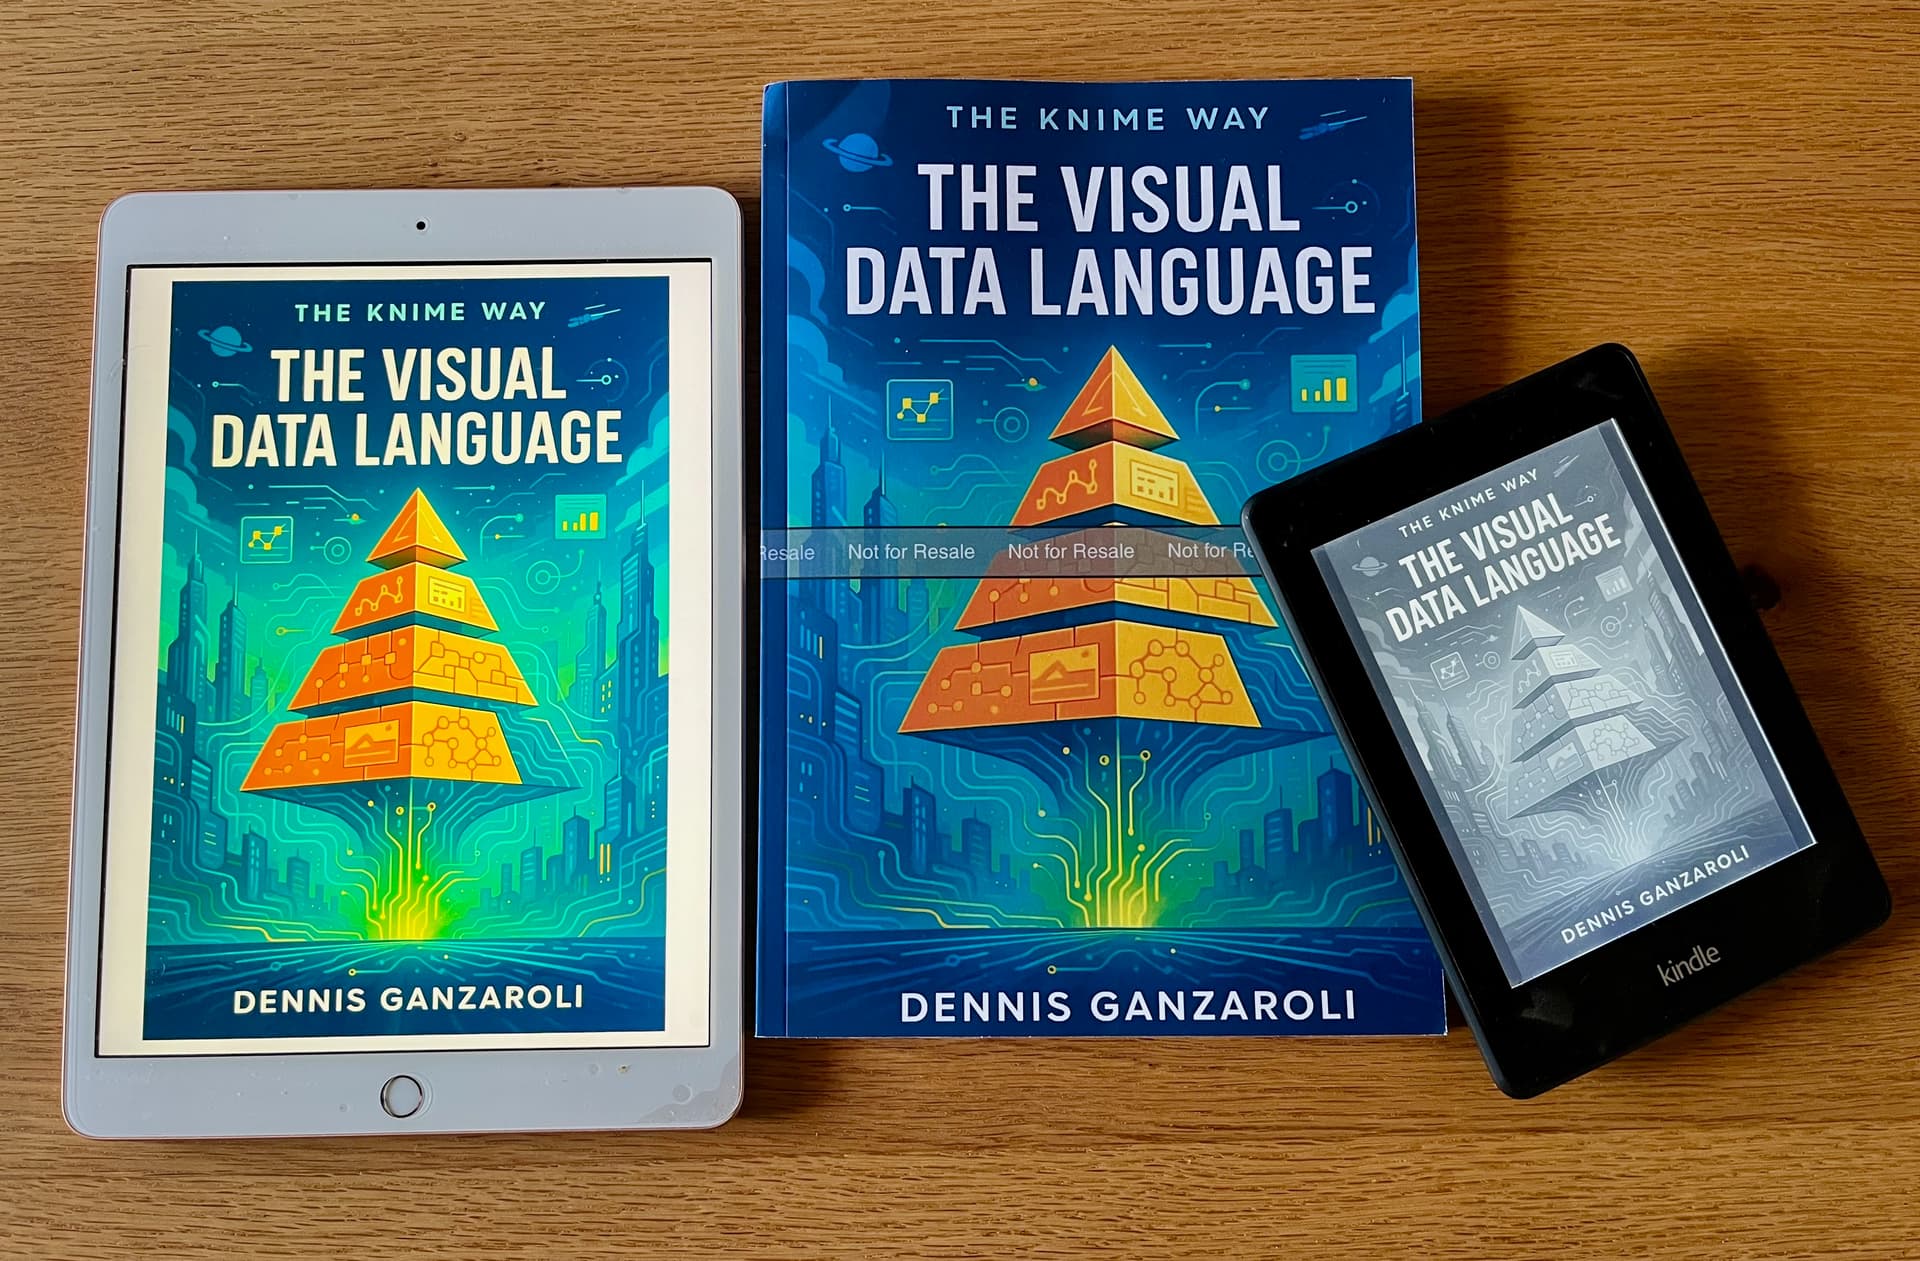
my new book: The Visual Data Language
My 𝗯𝗼𝗼𝗸 📖 is now available as a 𝗽𝗮𝗽𝗲𝗿𝗯𝗮𝗰𝗸 and on Kindle:
”*The Visual Data Language” from “The KNIME Way”* series!
👉 check it out here: https://mybook.to/thevisualdatalanguage
𝐓𝐡𝐞 𝐁𝐨𝐨𝐤 is for 𝐁𝐮𝐬𝐢𝐧𝐞𝐬𝐬 𝐀𝐧𝐚𝐥𝐲𝐬𝐭𝐬 and 𝐃𝐚𝐭𝐚 𝐏𝐫𝐨𝐟𝐞𝐬𝐬𝐢𝐨𝐧𝐚𝐥𝐬 who want to get real work done and see results!
Explore real-world workflows with KNIME , such as:
📊 𝐏𝐞𝐫𝐬𝐨𝐧𝐚𝐥 𝐅𝐢𝐧𝐚𝐧𝐜𝐞: track and analyze your expenses with Excel and KNIME
📈 𝐒𝐚𝐥𝐞𝐬 𝐑𝐞𝐩𝐨𝐫𝐭𝐢𝐧𝐠: transform raw sales data into dashboards and insights
🌦️ 𝐖𝐞𝐚𝐭𝐡𝐞𝐫 𝐀𝐧𝐚𝐥𝐲𝐬𝐢𝐬: loop through datasets and APIs to compare trends
💹 𝐅𝐢𝐧𝐚𝐧𝐜𝐢𝐚𝐥 𝐃𝐚𝐭𝐚: retrieve and analyze stock prices for market tracking
⚽ 𝐒𝐩𝐨𝐫𝐭𝐬 𝐀𝐧𝐚𝐥𝐲𝐭𝐢𝐜𝐬: apply predictive models to football match outcomes
🎨 𝐀𝐝𝐯𝐚𝐧𝐜𝐞𝐝 𝐕𝐢𝐬𝐮𝐚𝐥𝐢𝐳𝐚𝐭𝐢𝐨𝐧: recreate Minard’s iconic chart with K-AI, and Python
all avaible in my Public space “*The KNIME Way”* here:
Along the way, you’ll also set up your own productive data science infrastructure: choosing the right operating system, software packages, and even configuring a dedicated workstation tailored to your needs.
This 𝐁𝐨𝐨𝐤 is the practical guide to data science that helps you focus on what matters:
solving real problems, sharing clear workflows, and building confidence in your daily work.
👉 Start your journey into visual data science today—discover 𝐓𝐡𝐞 𝐊𝐍𝐈𝐌𝐄 𝐖𝐚𝐲.