Getting Started
What is KNIME Analytics Platform?
KNIME Analytics Platform is an open source software tool with an intuitive visual interface for your data projects. By combining nodes specialized in different tasks (data access, processing, analysis, visualization, etc.), you can build a workflow that suits your goals. A variety of nodes are available for you to tackle from simple ETL projects to complex machine learning models.
You can download KNIME Analytics Platform for free here.
Starting KNIME Analytics Platform
Selecting a workspace
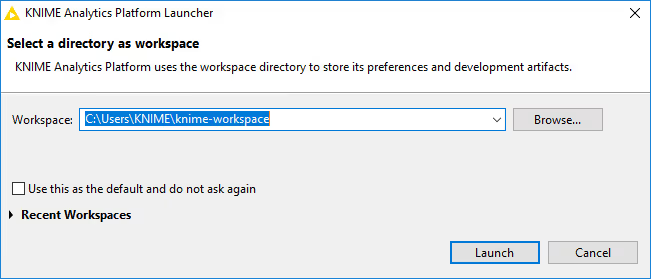
When you start KNIME Analytics Platform for the first time, you are asked to select your workspace. This is the directory where your projects reside on your local computer. You can accept the default workspace, or select a desired folder on your computer.
Entry page
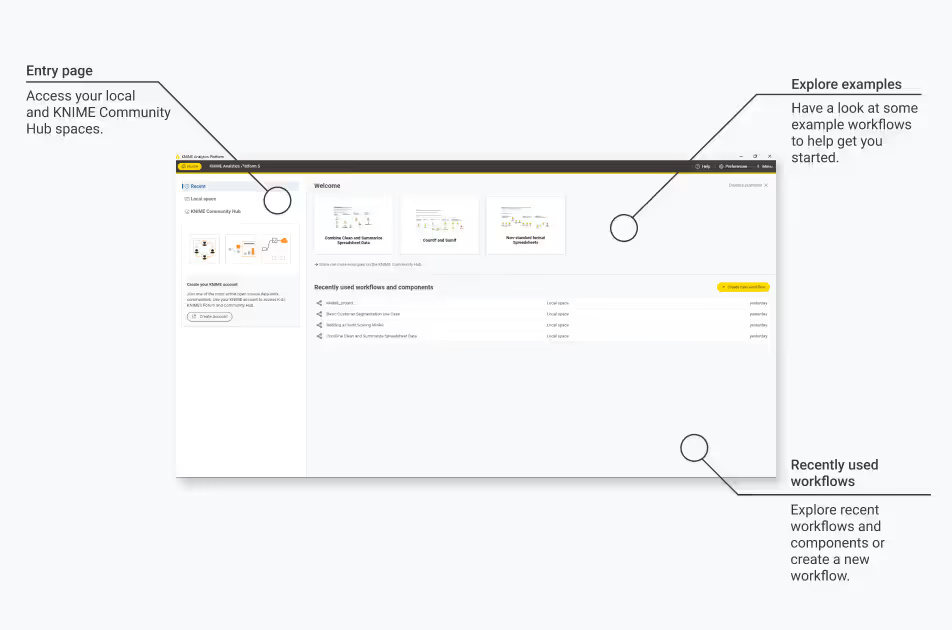
Once the workspace is selected, you see the entry page. You can start out with a few example workflows on this page, or you can create a new workflow from scratch. For this exercise, let’s build a workflow from scratch by clicking on the “Create new workflow” button. You can name your workflow, or proceed with the default name (e.g., KNIME_project).
User interface
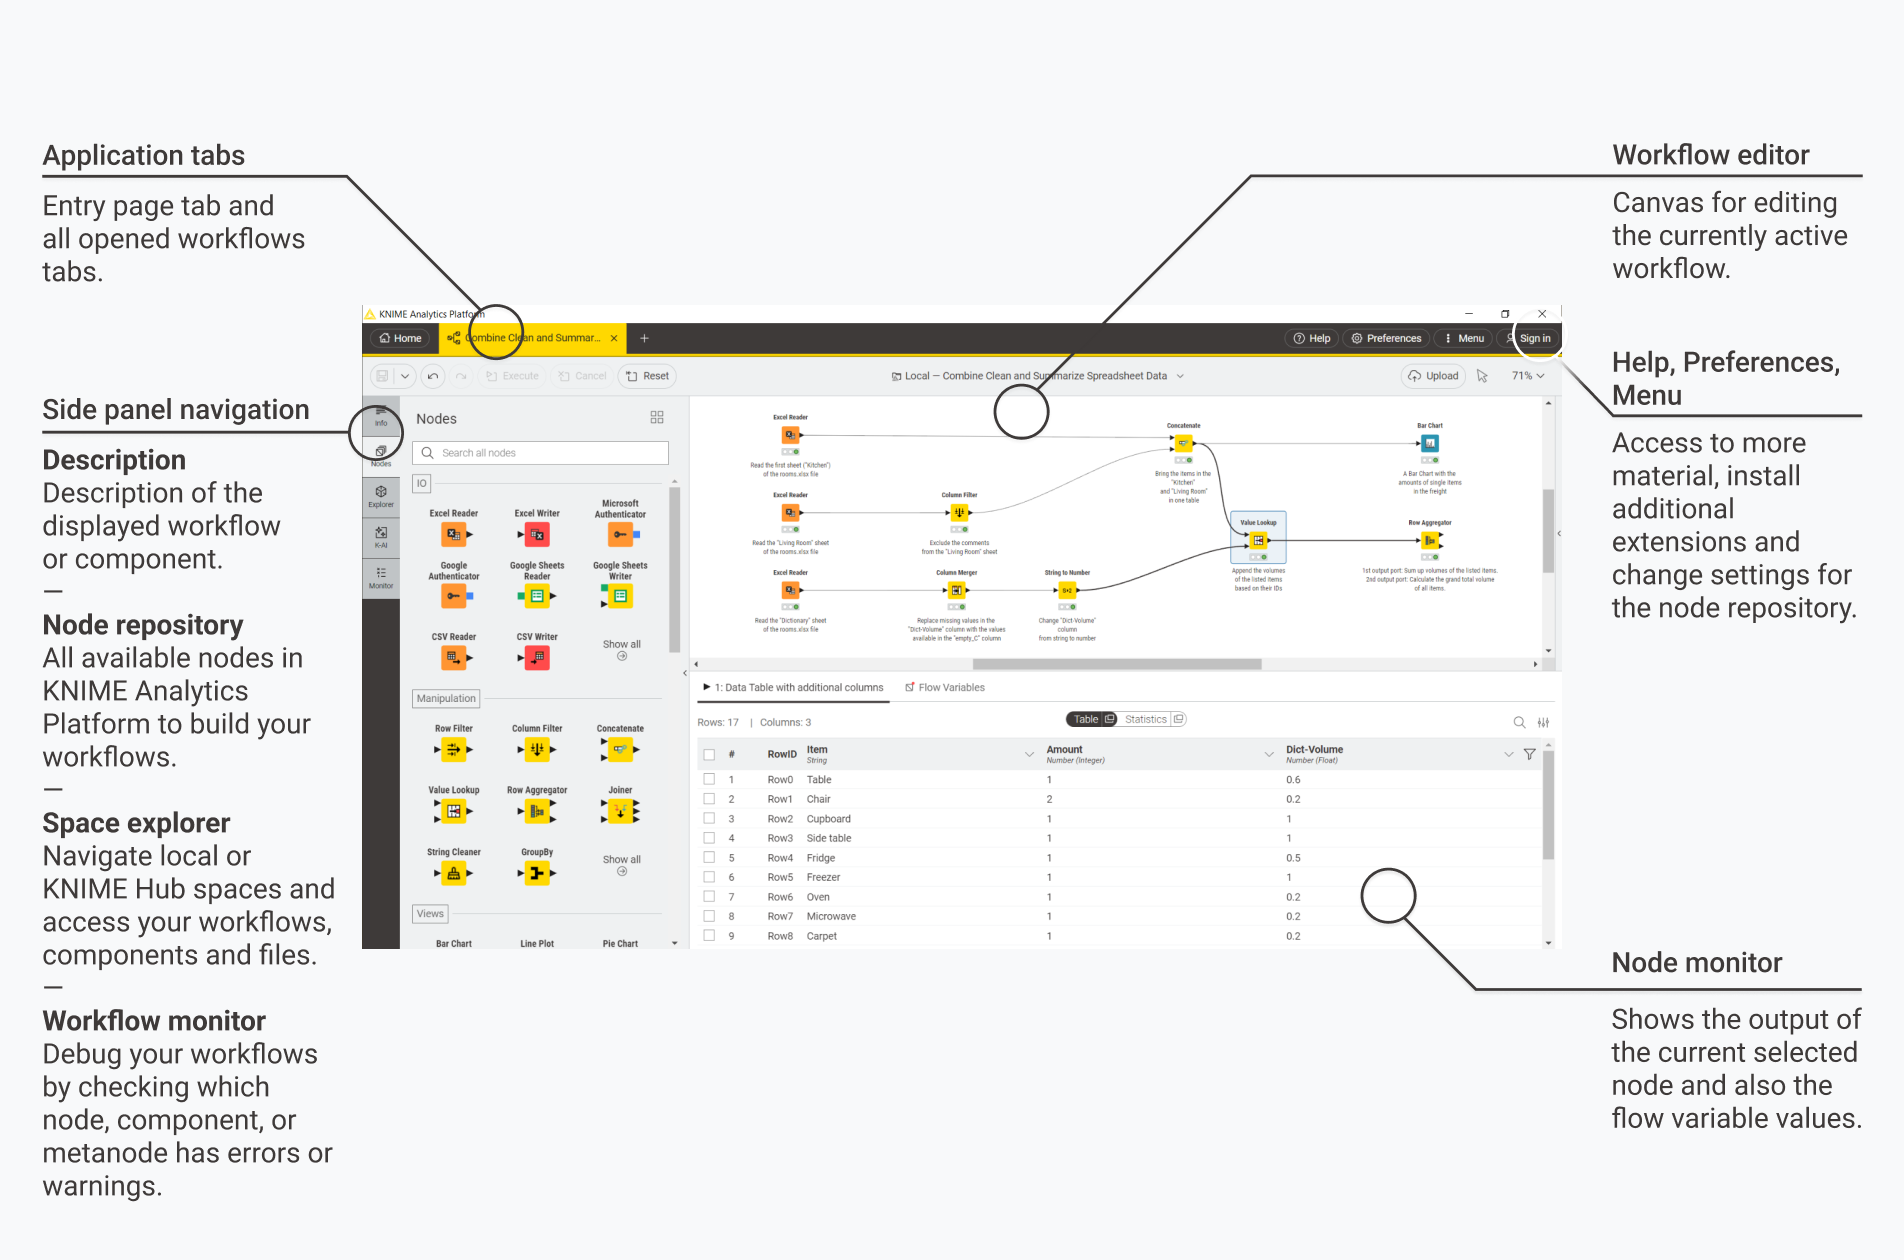
At this point, you see the user interface for workflow building. In the workflow editor, you combine nodes to build a workflow. On the left side panel, different tabs allow you to find
information about nodes and workflows (Info),
a catalog of nodes (Nodes),
a navigation menu to explore the contents of your workspace (Explorer),
access to K-AI, our KNIME AI assistant that helps you build workflows (K-AI), and
details about errors or warnings in your workflow, which helps you debugging (Monitor).
On the bottom of the workflow editor is the node monitor where you can preview the output of a selected node. Next, let’s build a simple workflow using this interface.
Building Your First Workflow
Reading an Excel file
For this simple workflow, we will use one of the example datasets in KNIME Analytics Platform. Go to the “Explorer” tab on the left, open Example Workflows → TheData → Basics, and drop the Excel file Rooms.xlsx into the workflow editor.
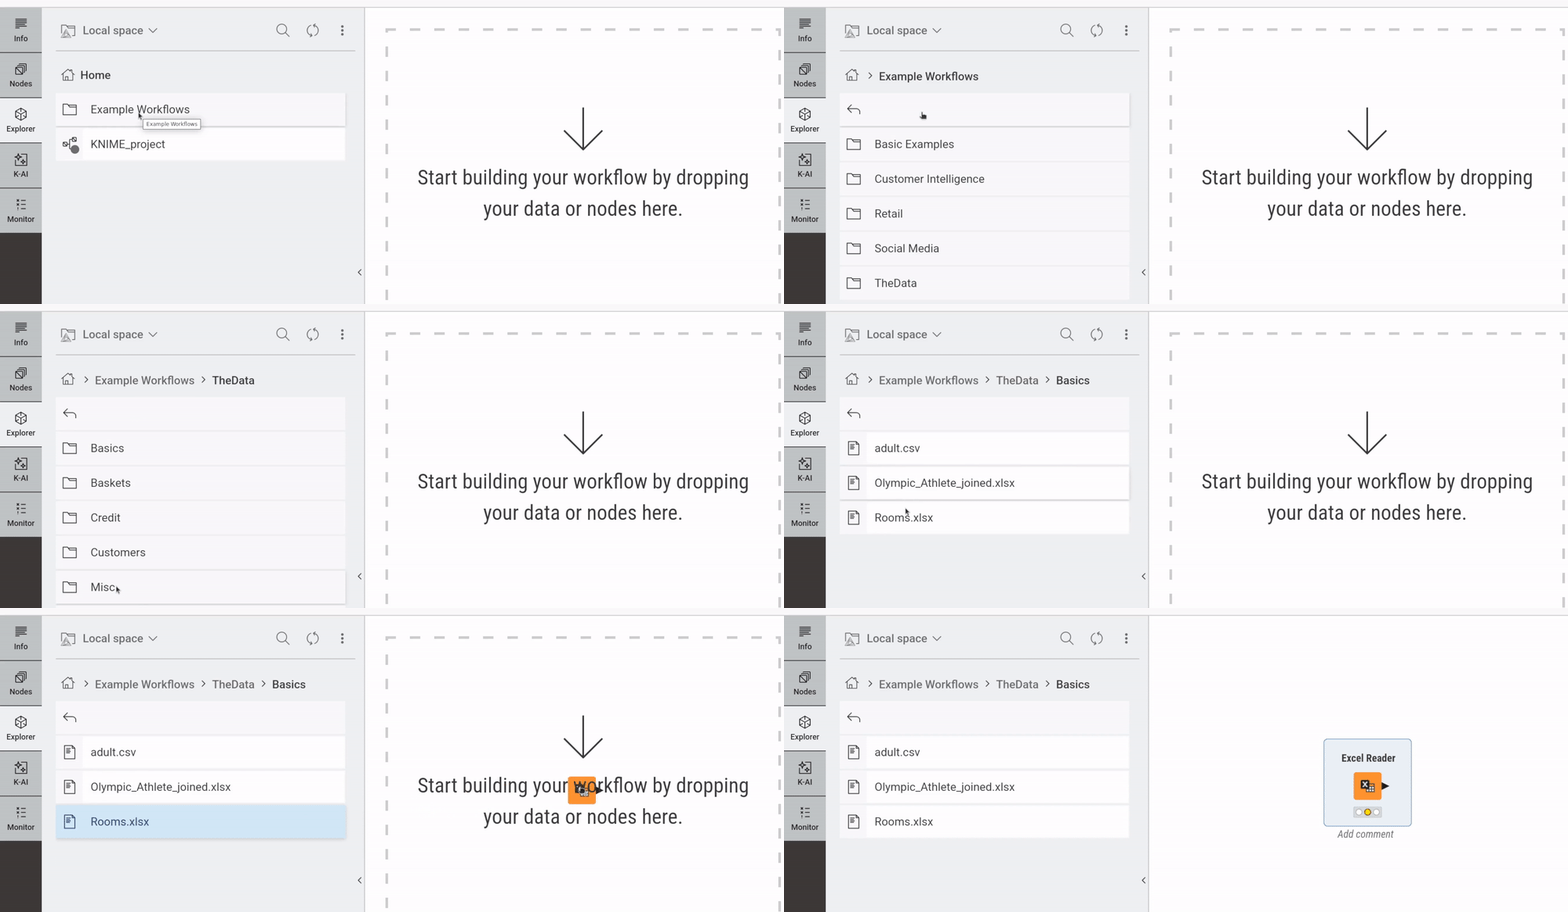
You see a new node, Excel Reader, in the workflow editor. This node is used to read data from an Excel file. Since you dragged and dropped an Excel file (Rooms.xlsx) into the workflow editor, KNIME Analytics Platform guessed that you were trying to read an Excel file, and automatically added the necessary node for that.
Executing a node
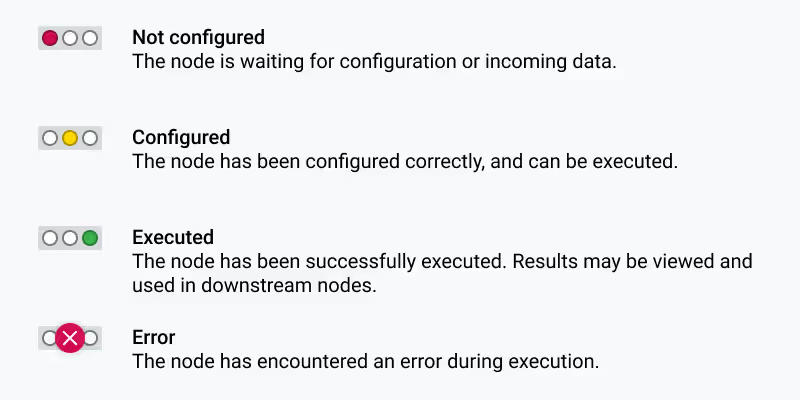
Hover your mouse over the Excel Reader node, and you see additional buttons. Click on the play button on the left. You see that the traffic light turns yellow to green, indicating a successful execution of the node (see the note below for different statuses indicated by the light).
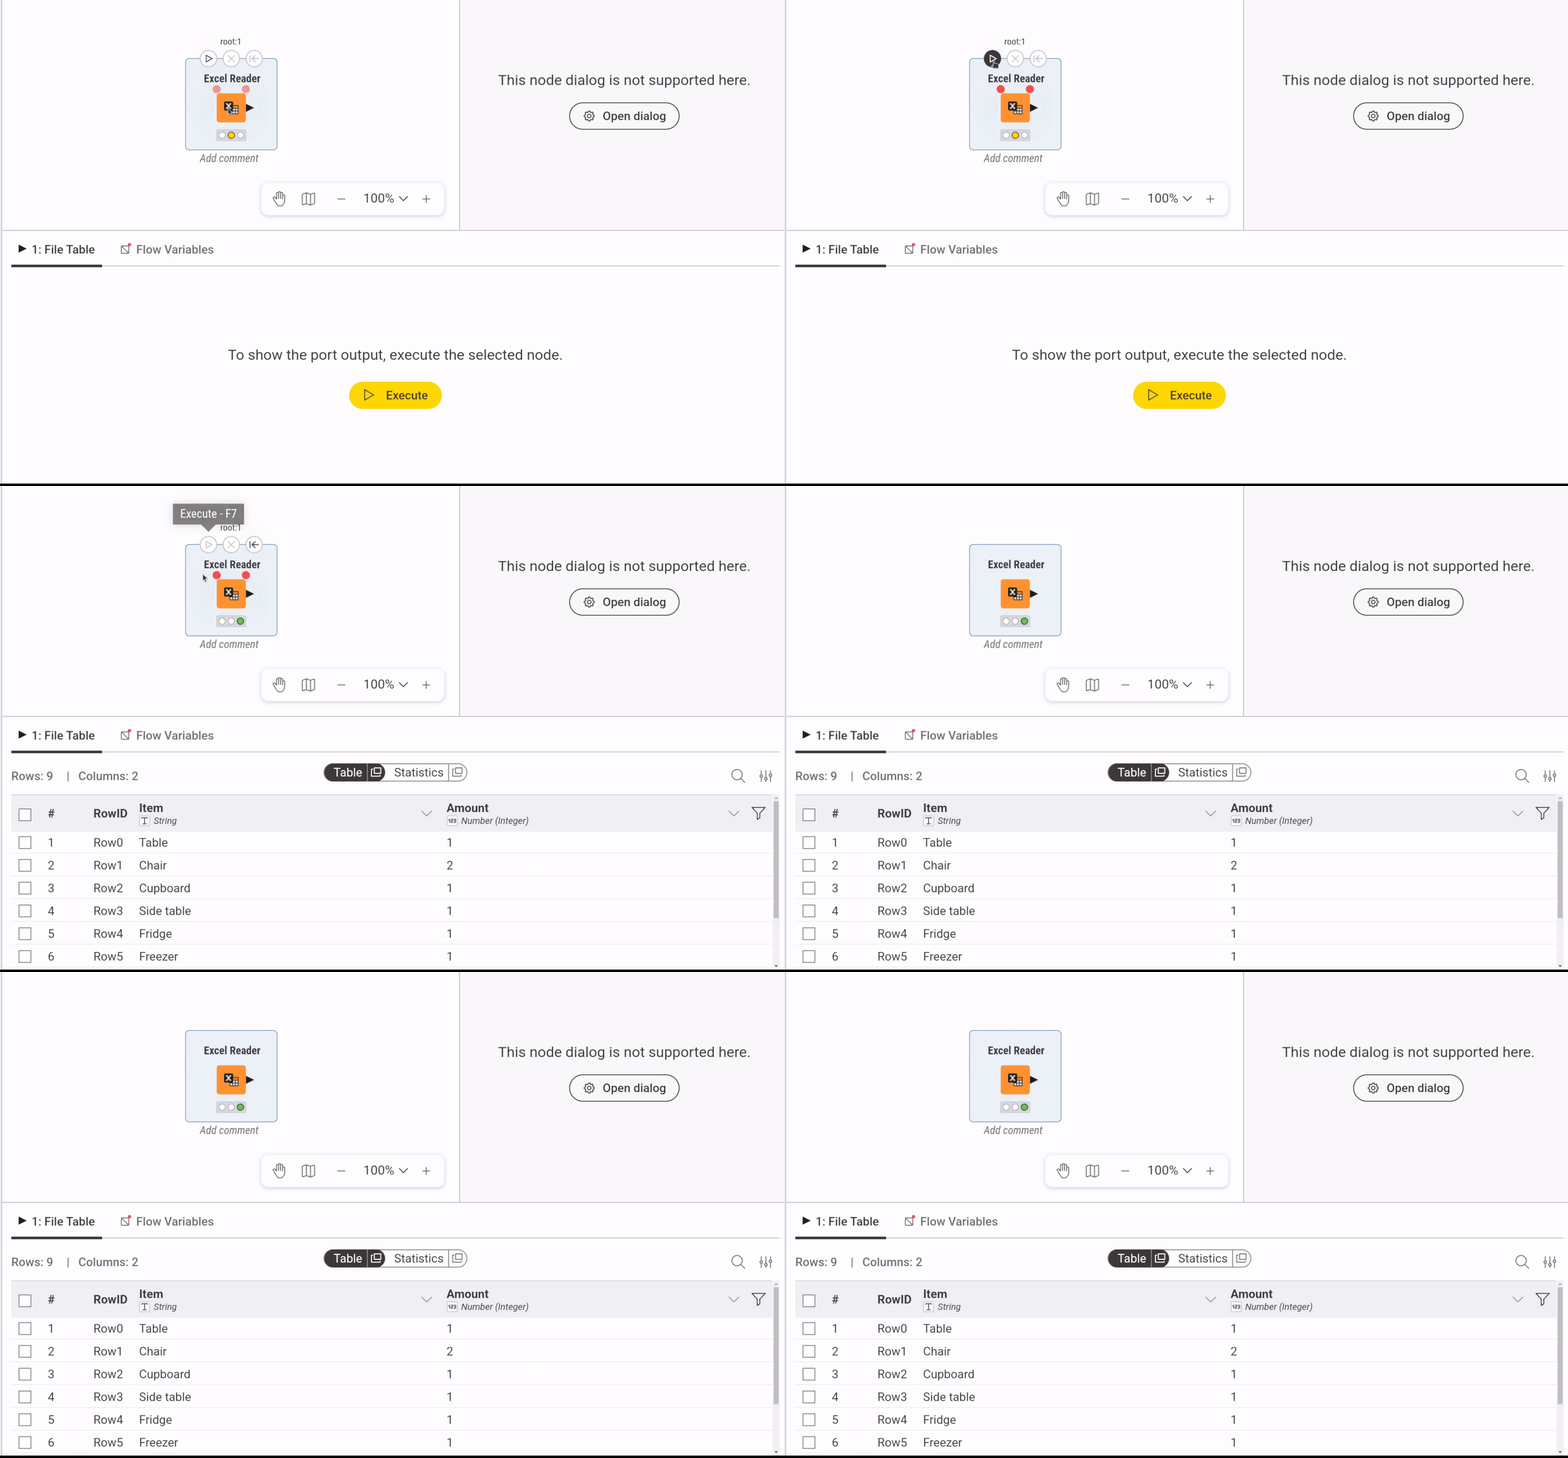
On the node monitor below the workflow editor, you can see the data read from the Excel file. It lists an inventory of furniture items.
Note: if you don’t see the data in the node monitor, make sure to click and select the Excel Reader node in the workflow editor, so that it is highlighted.
Note: The traffic light under each node indicates its status.
Adding a node
Next, let’s add another node to your workflow. Find the output port of the Excel Reader node, the black triangle on the right side. Then drag and drop it in the empty space on the right. This opens the quick node adding panel with recommended nodes. From there, select the Bar Chart node. You see that a Bar Chart is added to the workflow, with a line connected to the Excel Reader node.
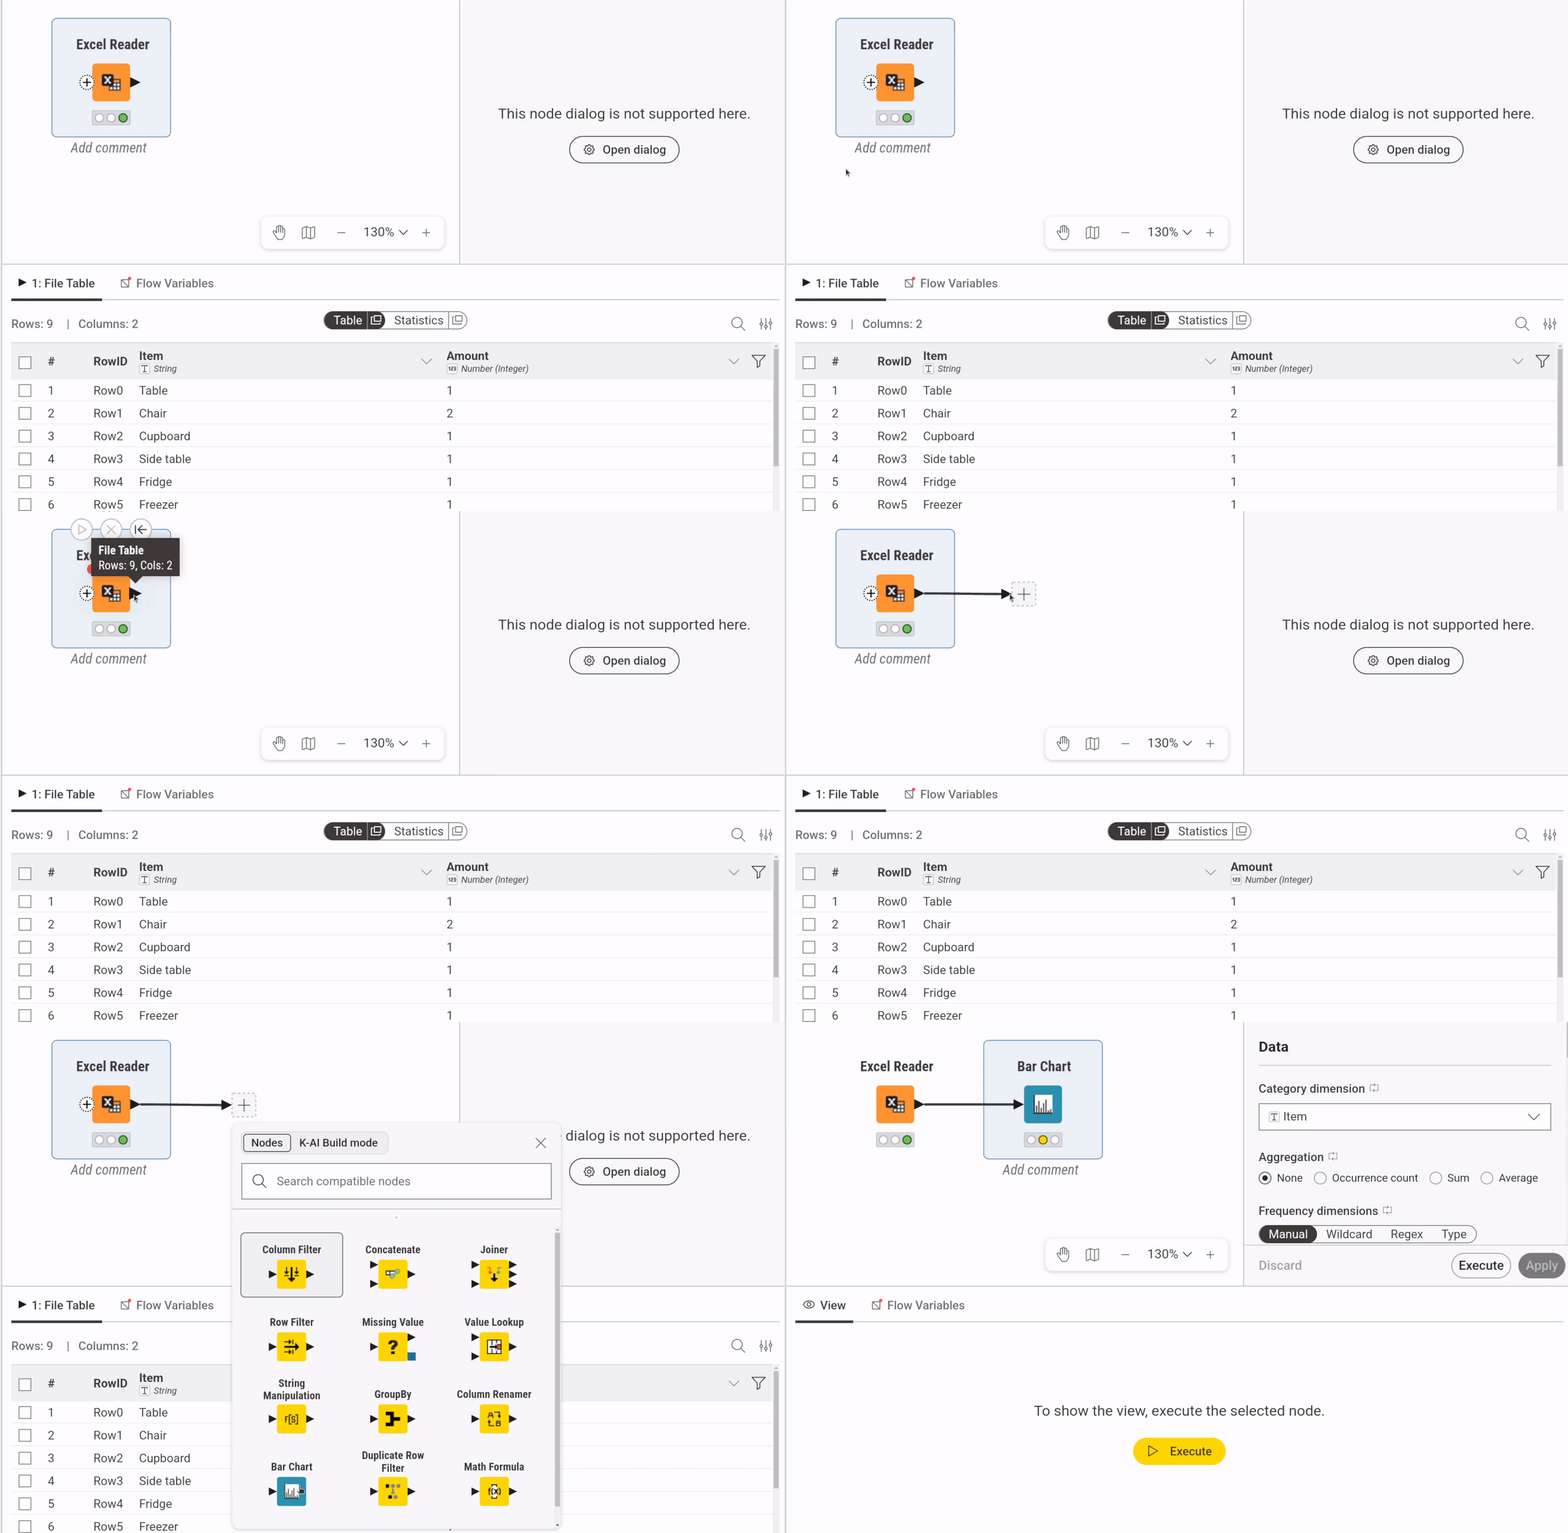
In KNIME Analytics Platform, data is passed on from left to right. Each node has an input port (or ports) on the left and an output port (or ports) on the right. Consequently, you build a workflow from left to right in the workflow editor. In the current workflow, the output data from the Excel Reader is passed to the Bar Chart node, with the connection indicating the flow of the data.
Visualizing data
As you can imagine from its name, the Bar Chart node produces a bar chart based on the input data. Hover your mouse over the Bar Chart node, and click on the magnifying glass button on the right. The node executes and opens a new window with a bar chart based on the data, an inventory of furniture items. There, you have your first visualization with KNIME Analytics Platform!
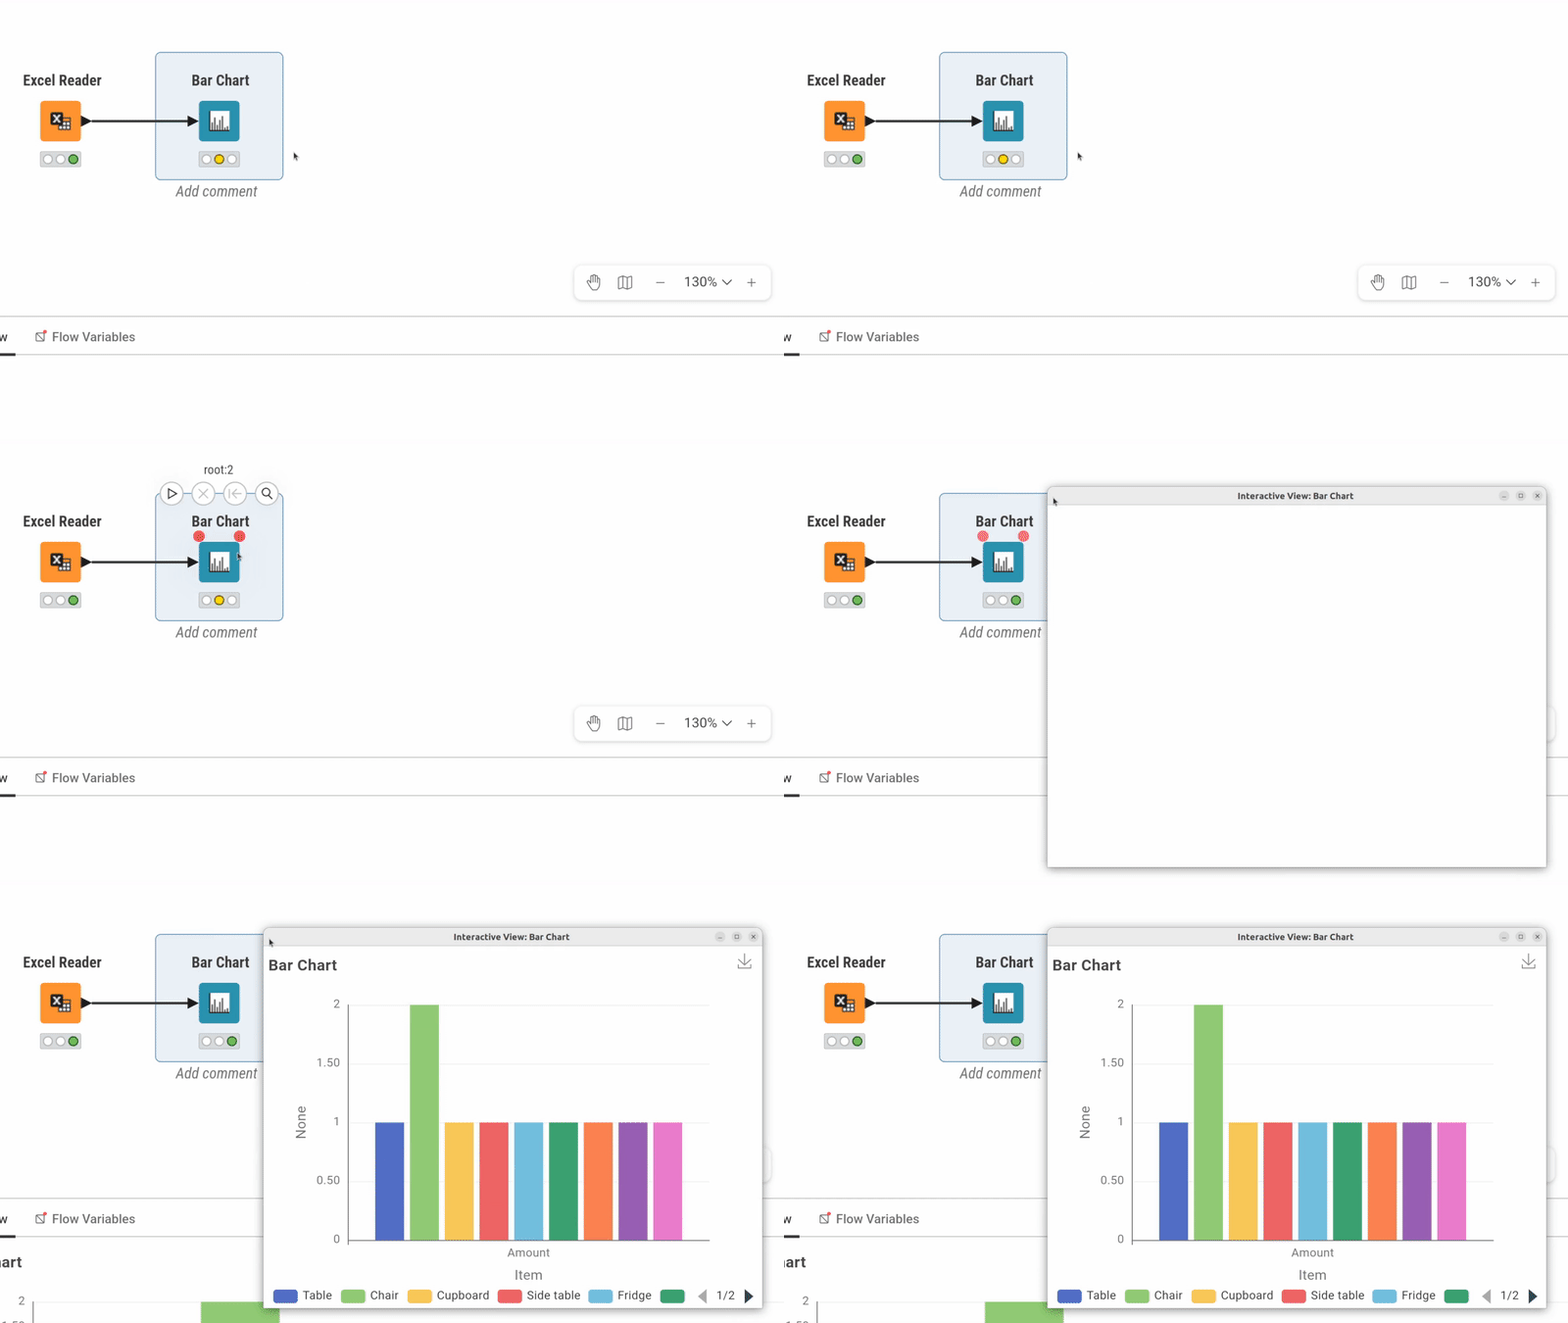
You can watch this YouTube video, showing the process of building the same workflow.