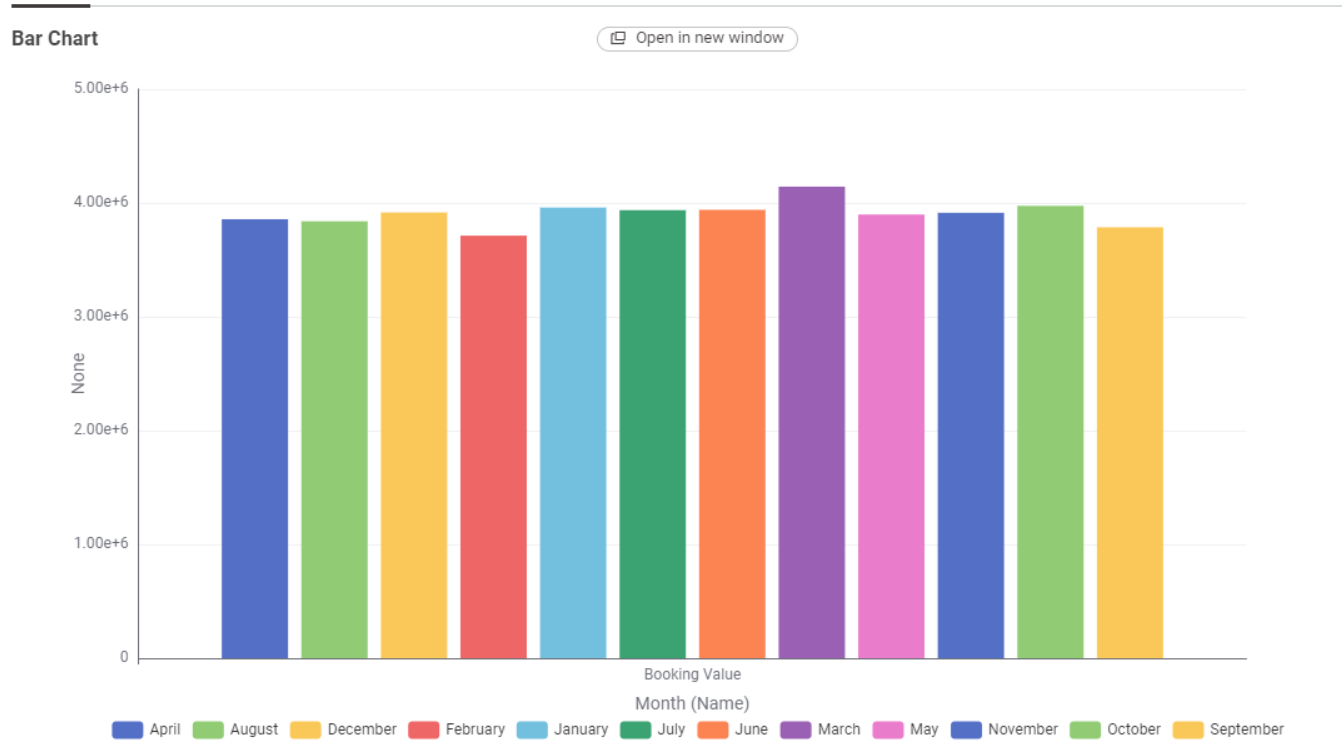
What is the fix for visualizations like bar chart converting values greater than 1 million into s...
I am trying to create a bar chart with monthly sales data, where x axis shows 12 months (names) and y axis is supposed to show the sum of sales. My issue is that y-axis is automatically getting converted into scientific notation is which not possible for others to read.
I tried using number format manager node to add commas (Eg: 1345 → 1,345). BUt even that is making no difference in the bar plot.
i read about number to string, but if i convert numbers to string how can i sum it up?
Please help