Visualization Plots
Hello everyone,
I have 2 issues about visualization
Issue 1: I use ‘R plot’ but it does not appear on Layout, so I have to use ‘Image Output Widget’ to show this plot but how can I config the size of ‘Image Output Widget’ to adapt with window size? Now, I only can fix max width and height size.
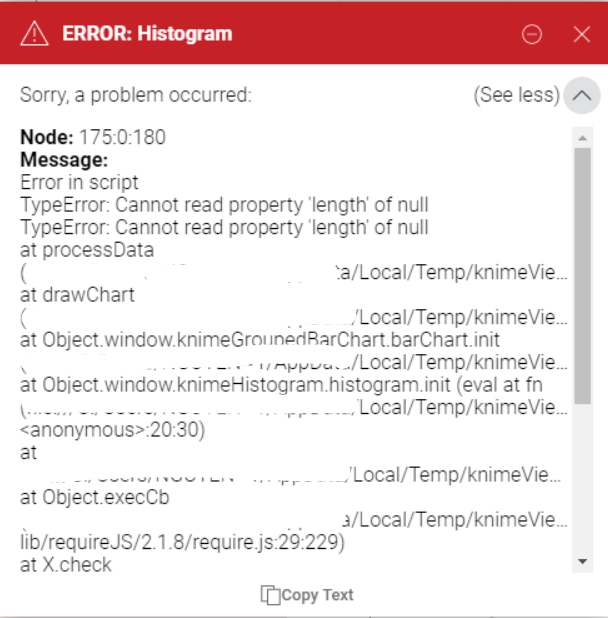
Issue 2: I create a node to choose input value then use ‘Histogram’ node to visualize data. But the layout has error.
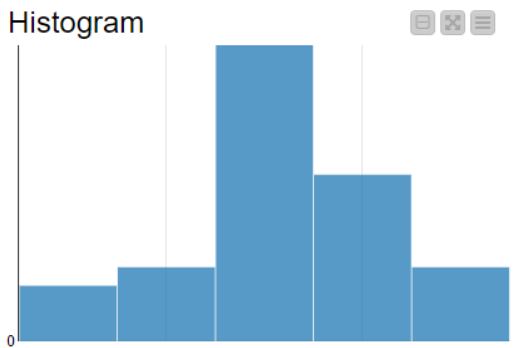
However, when I reset Histogram node then execute, the layout can show my histogram.
Thank you for your help in advanced.