Troubles dealing with bar chart stacked 100%
Hello Community!
We’ve been having a trouble with the visualization of the bar chart stacked 100%.
We want to visualize two bars of the variable “Type of Transaction” and the payment method used inside of each bar.
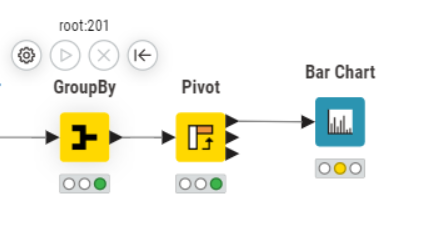
After this combination of nodes the output is
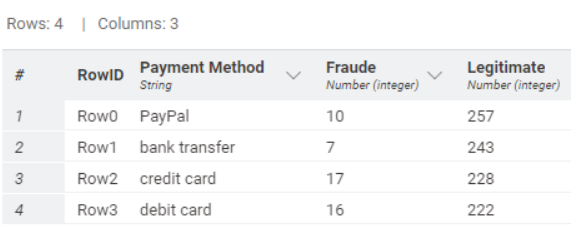
We are trying to use the node Math Formula to calculate the percentages, but we didn’t reached the way to do it so far.
Thank you for your help!