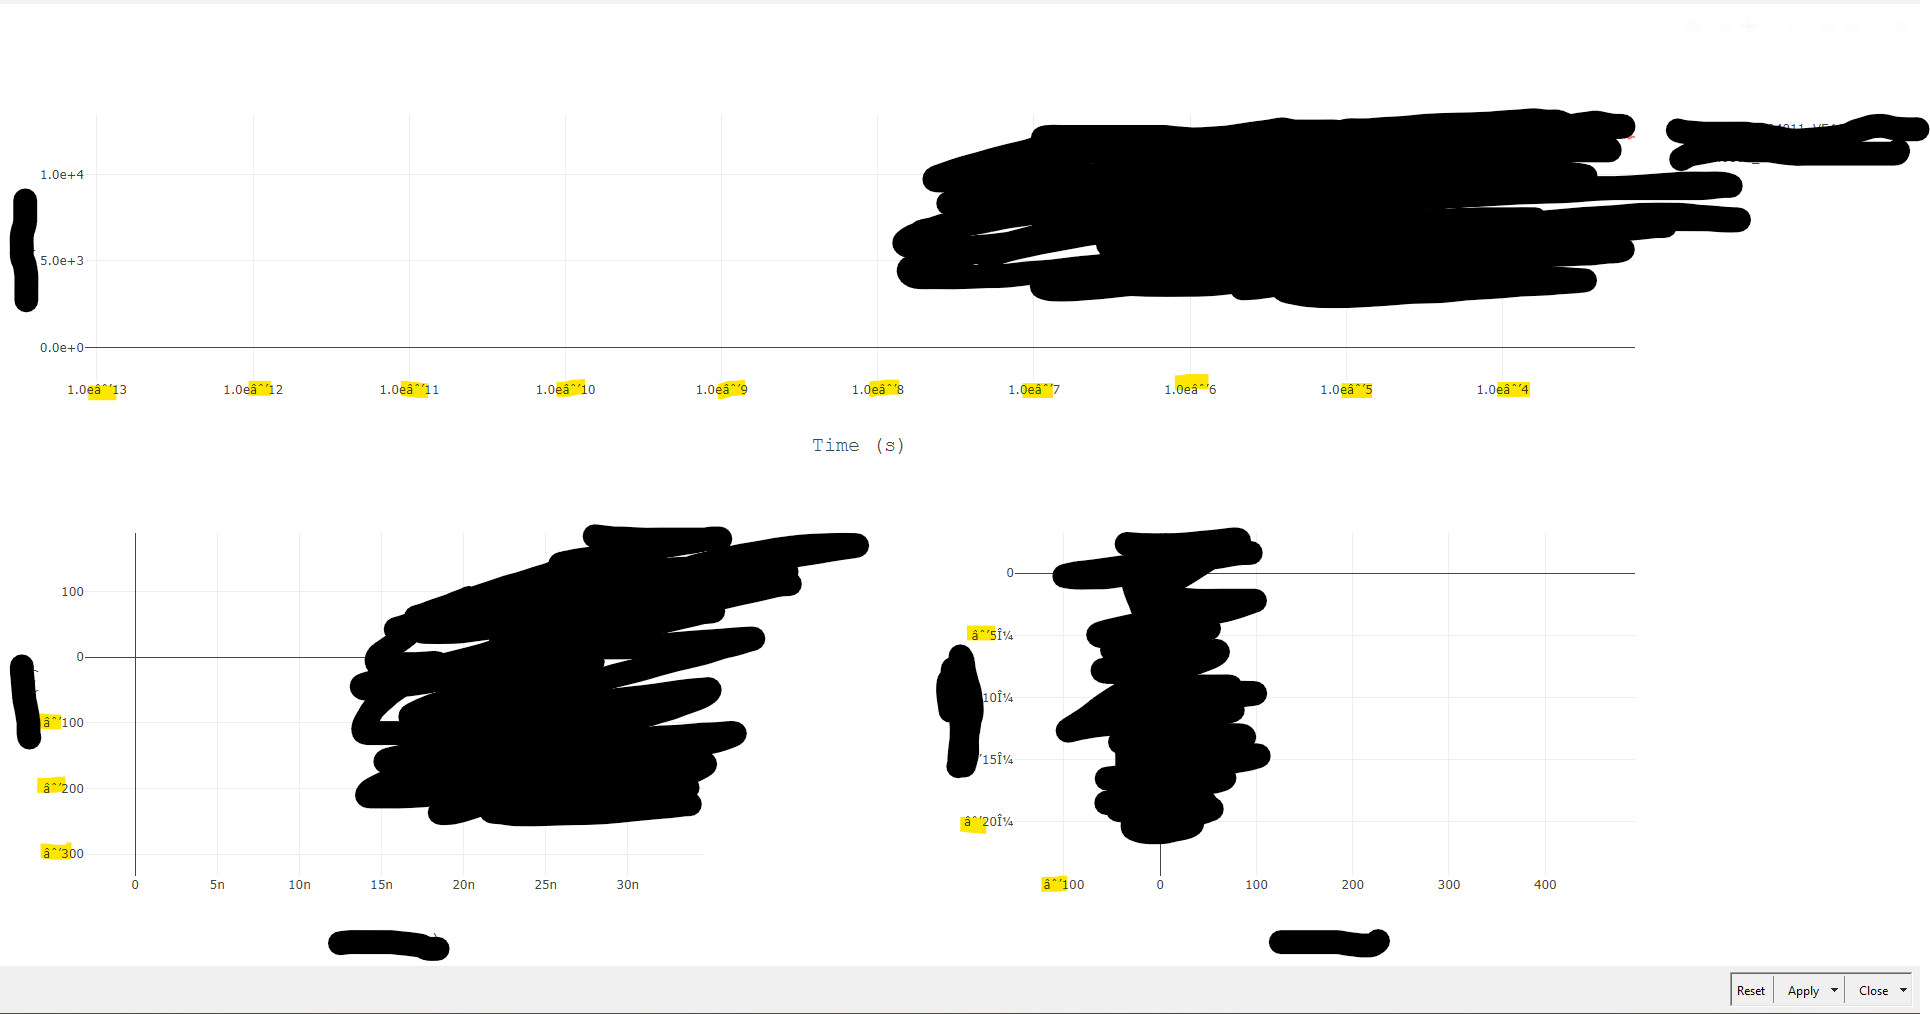
Strange negative axis values in Ploty.js
Hello everyone,
I am using a javascript-view with the Ploty.js - Version 2.26.0 dependency for creating some plots. I noticed that axis values who are negative, display “â^'” instead of an “-”. I was not able to find anything in the Ploty.js forums about that bug. It seems to be related to the charset used.