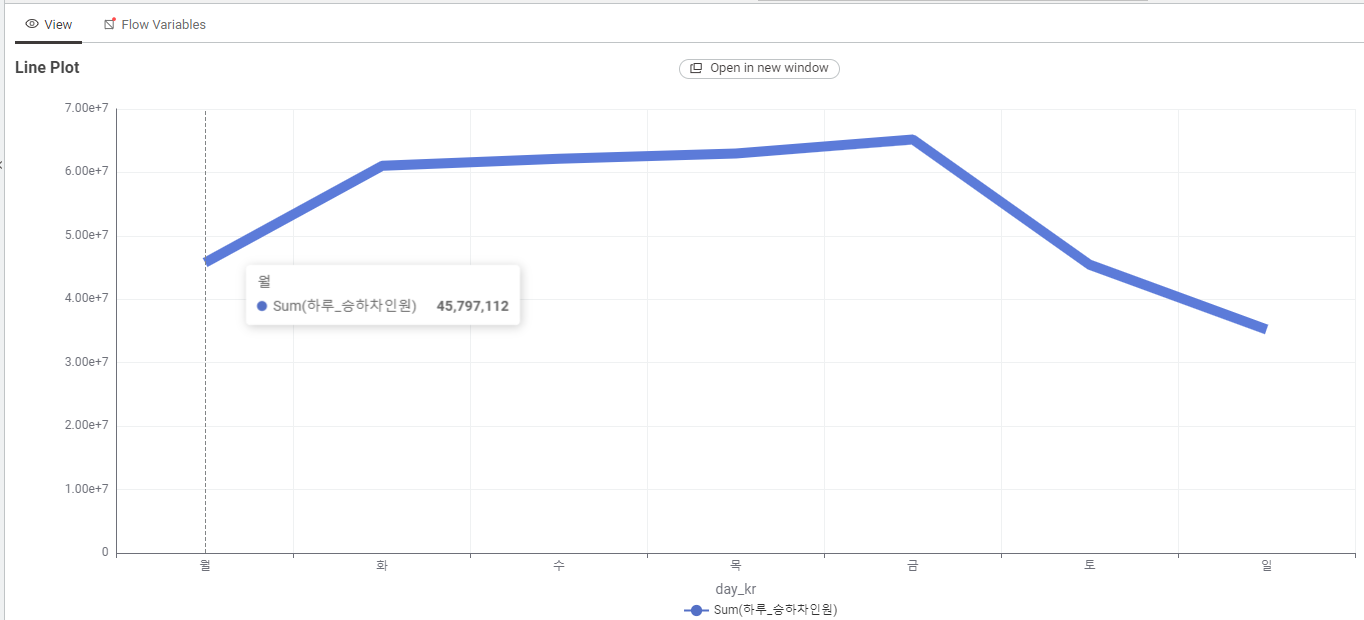
Set Line Plot y-axis values
Hello.
When configuring a Line Plot, if the y-axis value is specified as a large value such as 45,000,000, it is expressed as 4.00e + 7 as shown in the figure. The same is true when the figure is zoomed in. Is there an option to change it to the value expressed on mouseover in the graph?