Reporting: Dynamic Chart creation
Hi,
I am a bit lost: I need to create a dynamic number of charts and tables for a report.
The number of charts depends on the number of “Type” which changes every now and then.
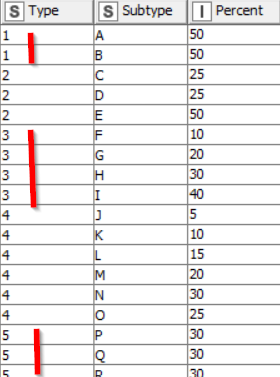
So for every type there needs to be a chart and a table with the subtypes in the report.
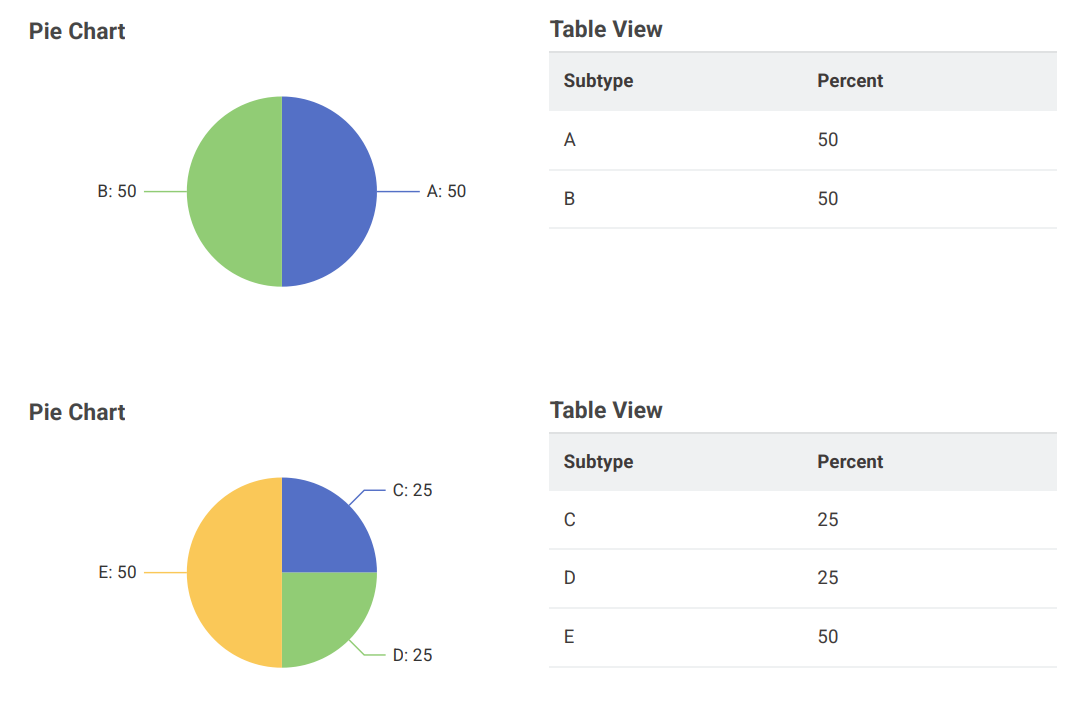
As the number of Types could be 5 or 25, how can I dynamically create the chart nodes (5 or 25) in the component?
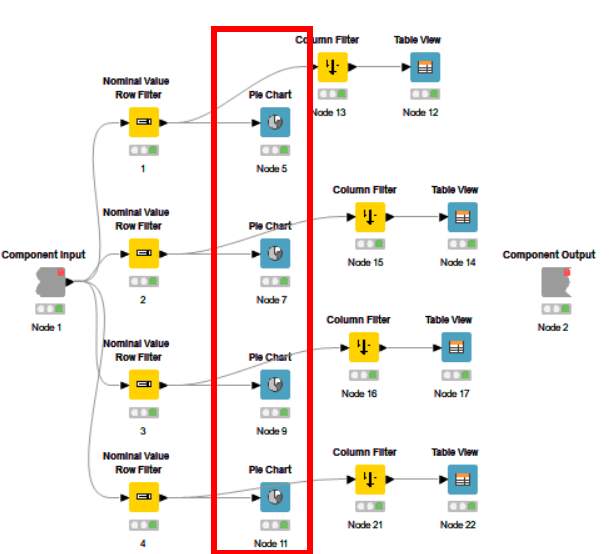
Is that possible at all?
Thanks for any hint!