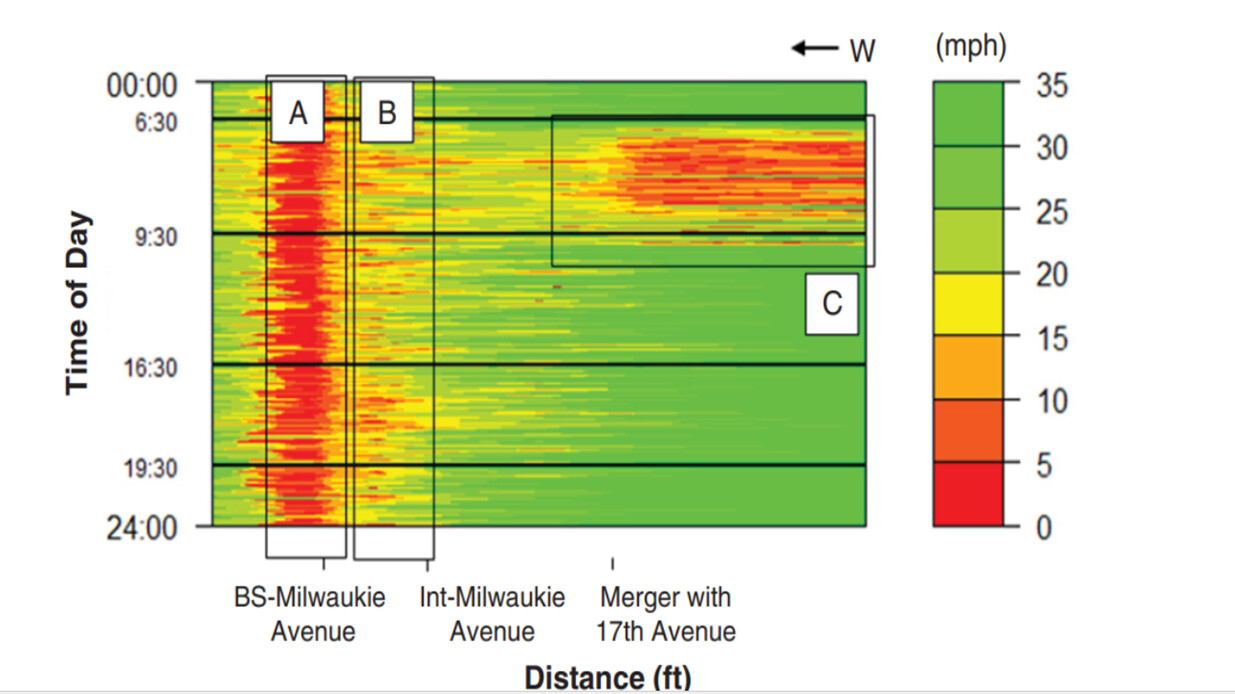
Plotting speed heatmap
I’d like to get support on how I can use my GPS log data recorded from buses that has time stamps, coordinates, and trip details be used to plot a speed heatmap in order to identify the sections that are facing reduced speed (or delays). I want to obtain plots like these as attached here. I see that MATLAB can be incorporated into KNIME. But as of now, I havent got asolid ground to start with this requirement.