Plot multiple series of data on one plot
Hello everyone,
I have multiple values series I would like to draw on the same plot but the information on which serie the values is from is in a line.
My input data are the following format :
| Probe | Param A     | Param B     | Time | Probes state |
| 2     | 0           | 0           | 0    | 0            |
| 2     | 5.587641994 | 0.676904557 | 0.5  | 0            |
| 2     | 2.201407269 | 0.312587442 | 1    | 0            |
| 2     | 0.456207061 | 0.101925172 | 1.5  | 0            |
| 3     | 0           | 0           | 0    | 0            |
| 3     | 4.339078206 | 0.482884258 | 0.5  | 0            |
| 3     | 3.488354199 | 0.771082107 | 1    | 0            |
| 3     | 1.740710898 | 0.042079133 | 1.5  | 0            |
| 5     | 0           | 0           | 0    | 0            |
| 5     | 0.869201874 | 0.246838368 | 0.5  | 0            |
| 5     | 0.585464537 | 0.124907482 | 1    | 0            |
| 5     | 2.22687224  | 0.081106812 | 1.5  | 0            |
Here is what I want to obtain, for each probe the values of Param 2 vs time :
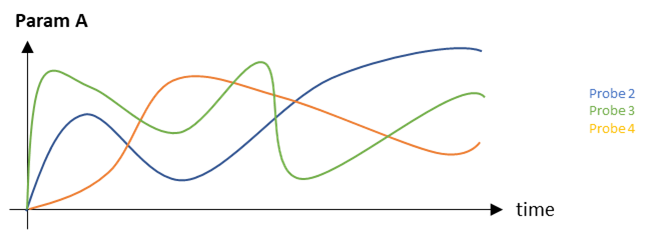
There is an additional difficulty as the number of probes is not set and may vary based on the input database.
I tried with “transpose” and “sortby” to create new columns for Param A for each probe for the “Line Plot” module (I think I already saw something like this work) but the data transformation wasn’t successfull.
Do you have any idea on how I can do this ?
Thank you.