MDS visualization
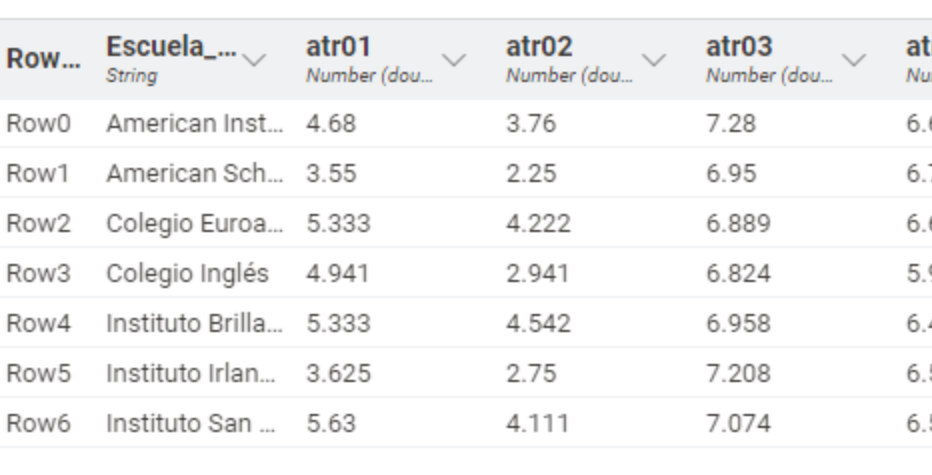
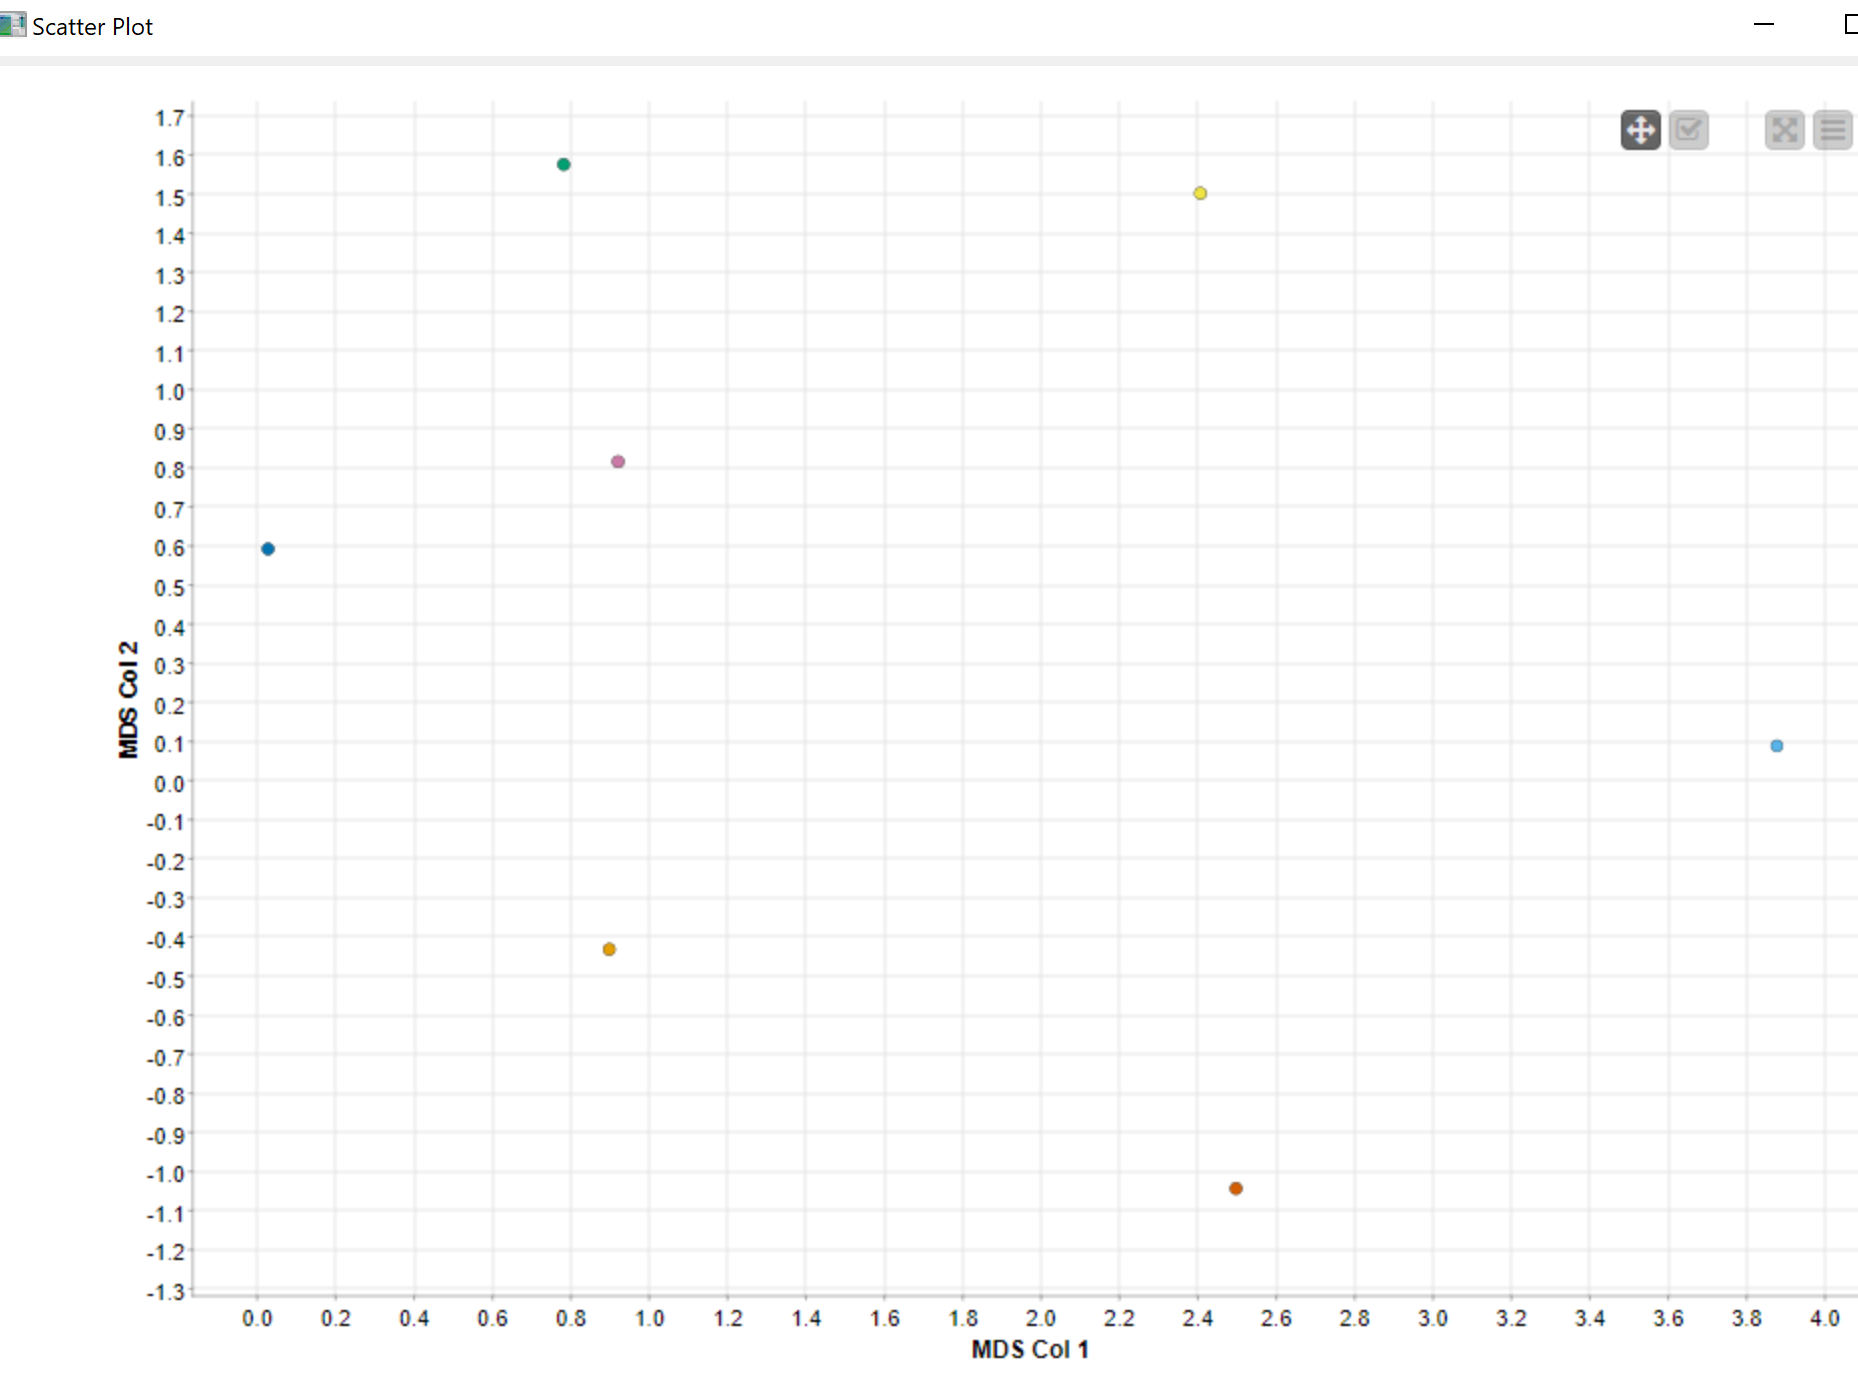
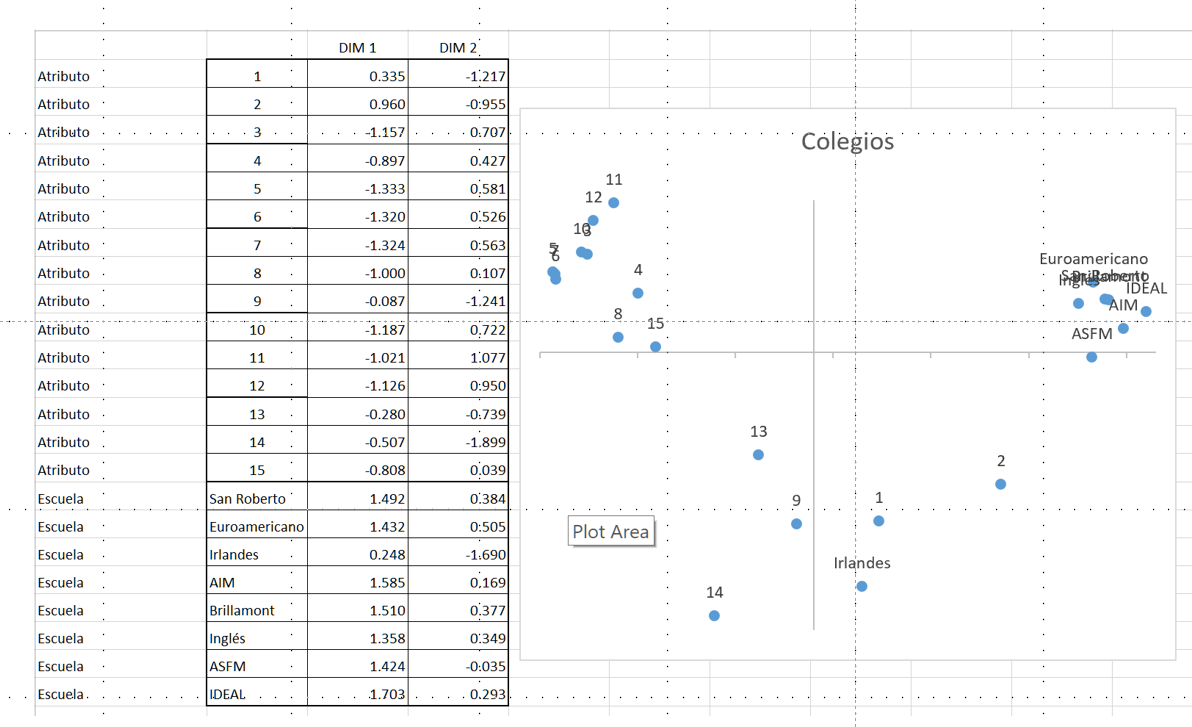
I have a table (pic 1) containing the evaluation of 7 Bands on 13 Features. Using the MDS node I get a map (pic 2) of the 7 Brands. What I need is the 13 Features to be on the map too. How can that be achieved. I do get that using SPSS (pic 3).