Line Plot Readability Fix
Dear Brian (@takbb ),
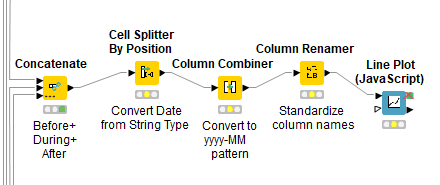
I am facing a somewhat similar issue. After preprocessing a large amount of data (gathered from three consecutive periods) into Knime, I have concatenated all the grouped data and needed to plot these data in a graph.
Here is this part of my workflow:
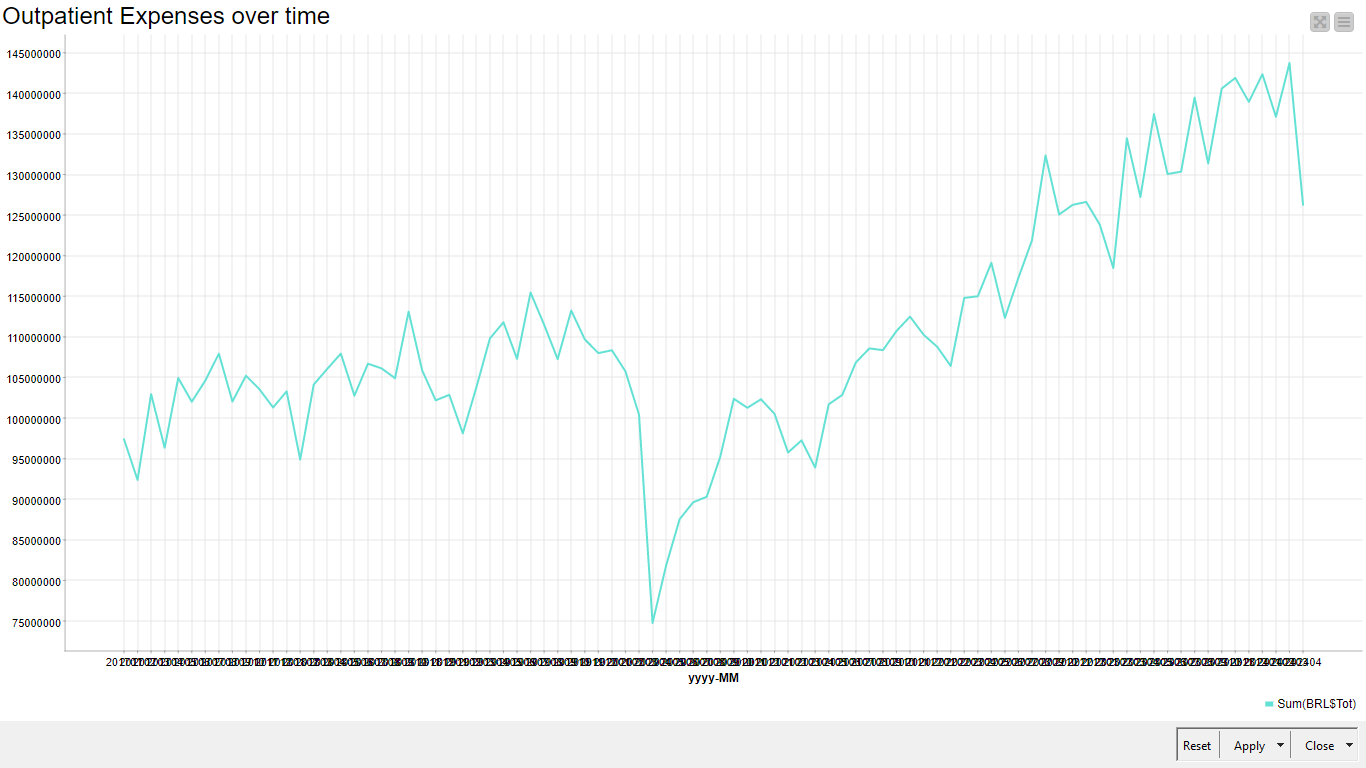
My problem: using the < Line Plot (JavaScript) > node, all the “x” coordinates overlap one another, making these x coordinates unreadable, as in the picture below:
My (unsuccessful) attempts:
a) I tried to export these data to a CSV file (using the CSV writer node, and configuring it to encode in UTF-8 type (File 1)), and then open the file into MS-Excel, which is much easier to use in building graphs. But some rows simply (randomly) appeared to be about 10-fold smaller, though (if reopened in Knime, using the CSV reader node) data did not semmed to be corrupted. The same occurred to me using the < Table Writer > and the < Table Reader > nodes, although this Table file cannot be uploaded here.
File 1:
Concatenation_before+during+after_PHEIC.csv
My questions:
1)How could I build a similar graph (into Knime, without using Python or R languages), but rotating the coordinates (dates, on X axis) by 90 degrees?
2) I still would need to determine the two angular coefficients for both the two visually distinct segments, adopting the Interrupted Time Series (ITS) tecnique. To implement the latter, I can split my data using the < Rule-based Row filter > node. I formerly have already done so, and both coefficients were more than 4.5 fold different one another.
3) I still wish to change the y coordinates from a high Double number to a Scientific Notation, but the < Math Formula > node does not recognize the Double column (just the Integer one). How could I do this? And the < Column Expressions > (with the < exp(x) function > renders a “infinity” result.
Thank you so-SO very much for all your help.
Rogério.