Joining tables based on Time
I have two spreadsheets:
One with port call records that show when a vessel arrives and departs a port.
Another with activity records that have timestamps for events that occur while the vessel is at the port.
My goal:
For each port call (the time interval between an arrival and the following departure), I want to create a combined timeline.
This timeline should show the arrival record first, then all the activity records that occurred during that interval (based on their timestamp), and finally the departure record.
In other words:
I want to join the two spreadsheets so that every port visit has its start and end time along with all the activities that happened in between.
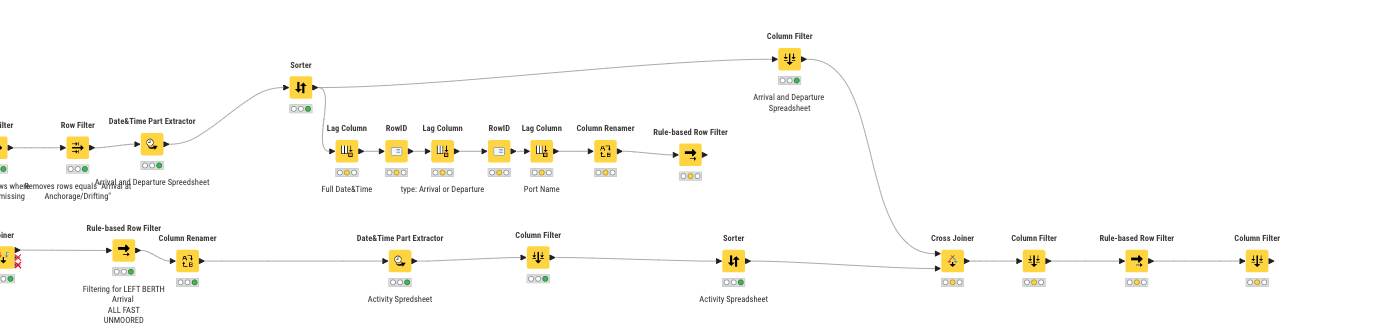
At this point, I’m stuck on the final part of my workflow. I’ve tried several approaches—some of which are still visible in my workflow—but I still haven’t achieved the desired result.
I attempted to lag three columns: Port Name, Date and Time, and Arrival. However, I discovered that the Arrival value was being taken from the previous trip rather than the current trip. As a result, the row would display an Arrival time from a different port than the corresponding Departure.
I realized that I should lag the Departure column instead of the Arrival, so that the Arrival appears first on the same row as its matching Departure. Unfortunately, I couldn’t figure out how to do that because the Rule-based Row Filter proved too complicated to use.
After using the Cross Joiner, I ended up with 200,000 rows. Although this was acceptable (since I planned to use the Rule-based Row Filter afterwards), I couldn’t get that filter to work properly, and I didn’t get the results I was looking for.