Issues representing missing values with Parallel Coordinates Plot nodes
Dear KNIMErs and KNIME lovers,
I need to visualise data using a parallel coordinates plot. I really like this type of plot because it allows us to compare variable trends at a glance. I also appreciate how KNIME has implemented this plot; however, unfortunately, it seems to have some issues when handling missing values. I will refer to the following data table to describe the problem, and you can also check the attached example workflow at the bottom for reference.
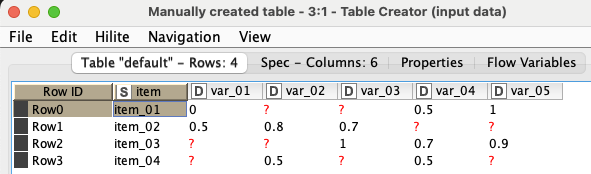
Currently, KNIME offers two nodes for this kind of visualisation:
*
Parallel Coordinates Plot
*
Parallel Coordinates Plot (JavaScript)
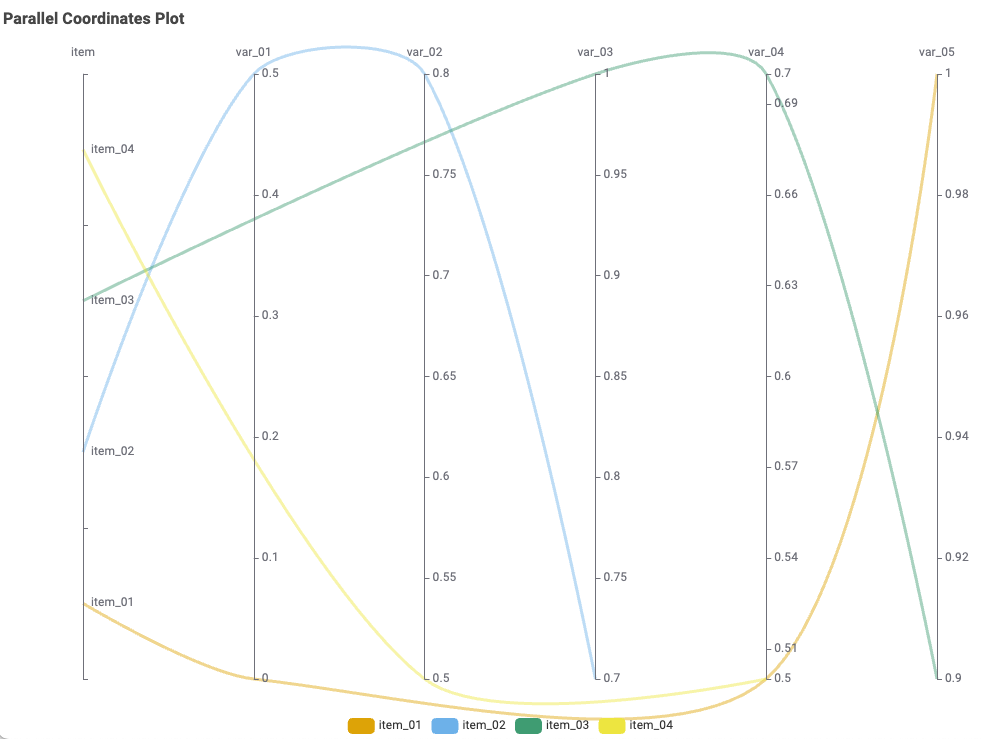
The *Parallel Coordinates Plot* node is a very nice implementation, but it only represents missing values correctly if they appear in the last columns, for example, var04 and var05 for item02; var05 for item_04. In this cases the line is correctly not represented in these cases (see figure below).
If missing values appear between columns containing non-missing values, sometimes they are represented correctly (var02 and var03 for item01; var03 for item04), but in other cases, they are not (var01 and var02 for item03: in this case, it appears item03 has var01 and var_02 defined but that’s not true!) (see figure below).
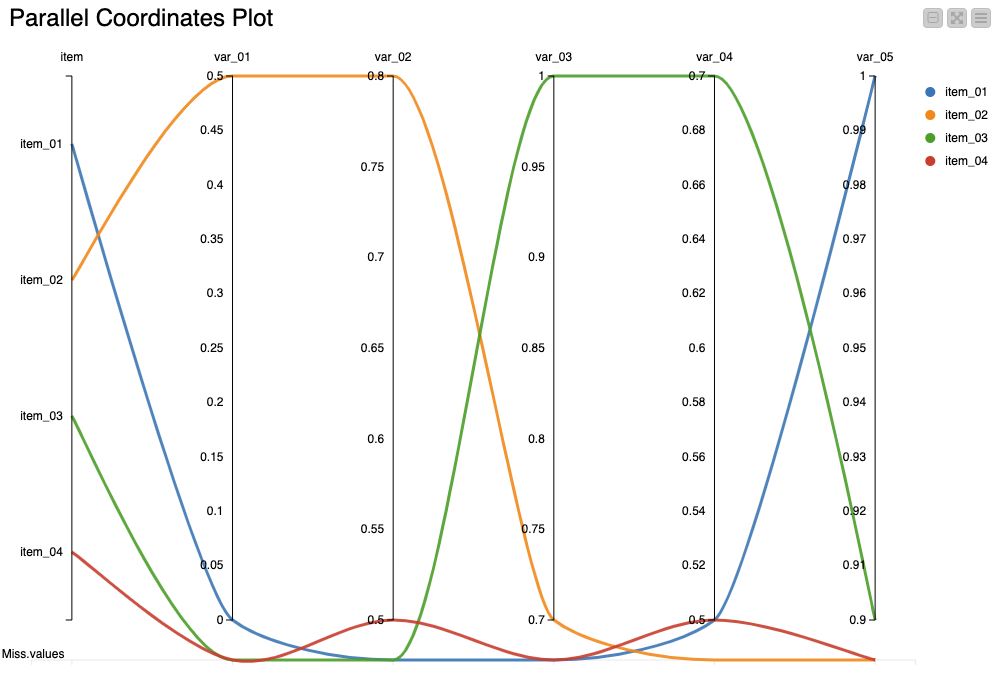
Using the *Parallel Coordinates Plot (JavaScript) node with the “show missing values*” option works better for reporting missing values correctly; in fact, all missing values are explicitly represented as missing (see figure below).
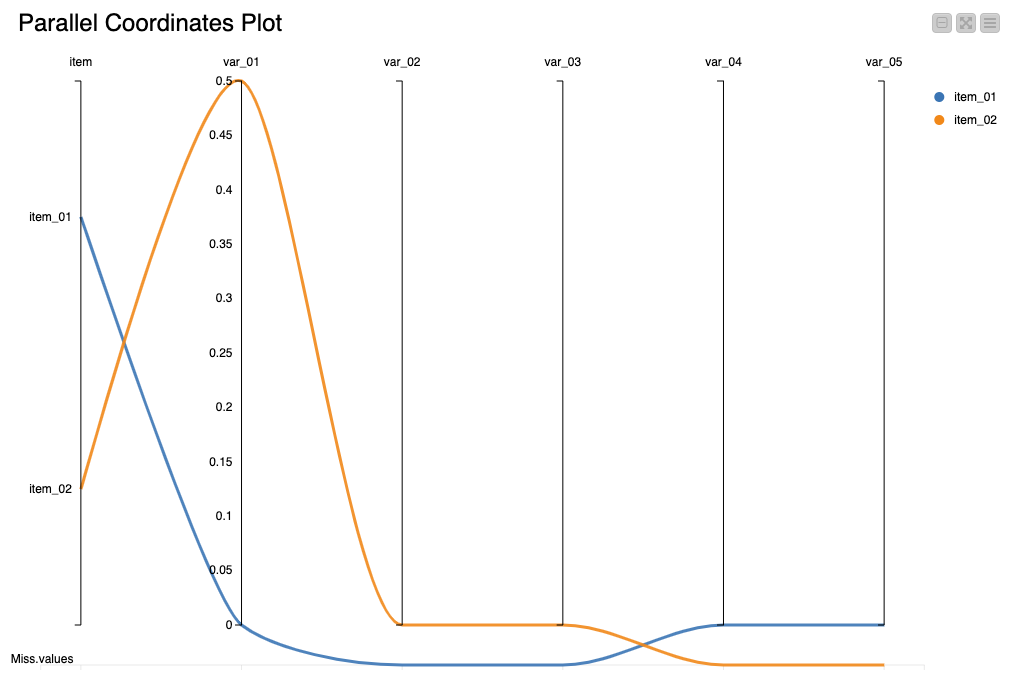
However, unlike the standard Parallel Coordinates Plot node, the JavaScript version does not display any axis values when only one value is present for a variable and this can be problematic (see figure below).
Does anyone have suggestions on how we can properly represent missing values in a parallel coordinates plot within KNIME, especially considering cases where only one value may exist for a variable?
I appreciate any suggestions or workarounds you might have on this matter.
Thank you in advance!
Gio