Inquiry about image to table by using Python Script node
Hello.
I want to draw several plt charts with python script nodes and make them into table rows.
But I don’t know how I can convert the plt charts to table row images.
Here is how I tried to do it.
But I get a type error.
ValueError: Data type 'binary' in column 'image' is not supported in KNIME Python. Please use a different data type.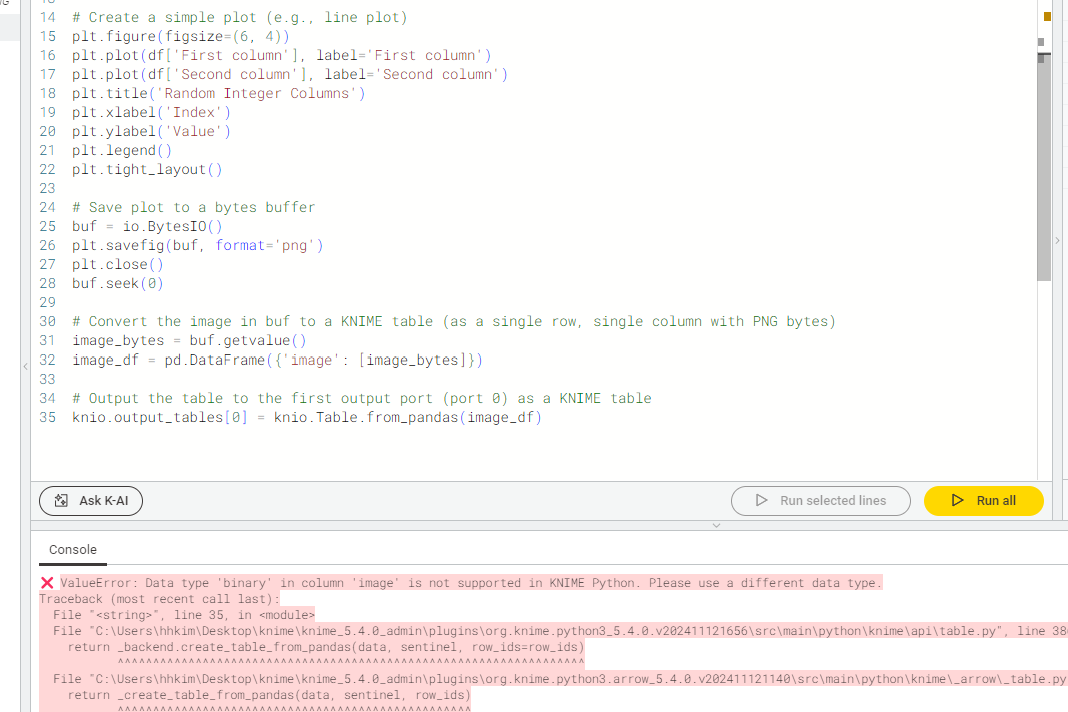
And I read the image using python script node to check the type.
"org.knime.core.data.image.png.PNGImageValueFactory"Is it possible to convert a plt chart to this type?
The reason I am trying this is to output multiple images as a table, because python script node can only output one image.
I’d appreciate it if someone could help me :slightsmile :slightsmile:
Best regards,
hhkim