Hybrid Graph
Fellow Knimers,
I don’t use charts often in Knime, hence I thought asking on the forum would get me a fast answer. I’m thinking of creating a hybrid graph - a mixed graph of a line chart and a bar graph.
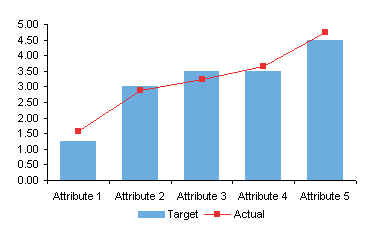
The image above is one I found on the net, just to show an example.
1.
Is it possible to create such a graph in Knime AP? If so, can someone point out to a workflow in the hub if you know of an example of this kind of project? I don’t even know what to call this type of graph, so I came up with the name hybrid graph.
1.
If the answer is yes, but requires Python, is there any alternative at all?
1.
Is it possible to have a graph like the image above but with a twist? I’m thinking of having two different Y-Axis ranges - there should be another Y-axis on the right hand-side for the second variable with its own range of values. The reason for this is because both of my variables have a really different set of range values - one is too small and another is too big - hence if they share the same Y-axis, the line chart might not be visible.
If there is no available workflow already in the hub, and you’ll need some data to work with to create a new workflow, I’ll provide the data.
Thank you in advance.