How to rotate the scale of a Line Plot?
Dear Knimers,
My data allowed me to build the following chart, using a Line Plot node:
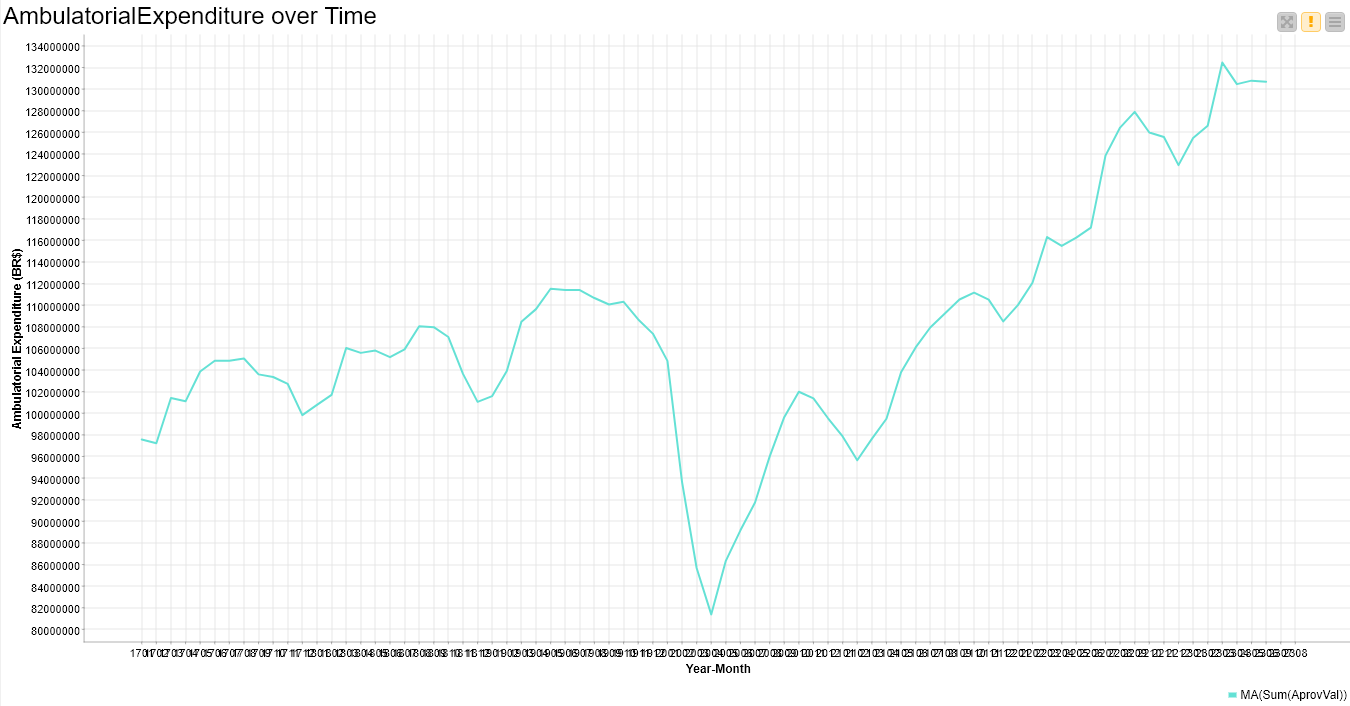
It’s fine (or almost), and it’s according to my data:
Chart - monthly PA vs Time.csv
But I’m facing a legibility problem on the scale of the x-axis. Data are grouped by year and month (2 digits each) and are presented in the format YYMM. I couldn’t find a control button (or something else with an equivalent function) to allow me a rotation (e.g., 45° or 90°) of the scale of the x-axis. I need that in order to avoid the superimposition of one value and the adjacents.
Can someone help me with this (supposedly easy) task? But I need to do that just using Knime functionalities, but not external capabilities (such as written command lines, in Python or R, etc.).
Thanks anyone might help me with this.
B.R.