How to interpret perplexity in topic modeling?
Hello everyone,
I would like to find out the optimal topic number by using the two-step perplexity method used in this workflow (“Block 2”):
Yet, I am not sure how to interpret the resulting charts correctly. Here is an example of how I would proceed:
Step 1 - wide topic range (2 to 80)
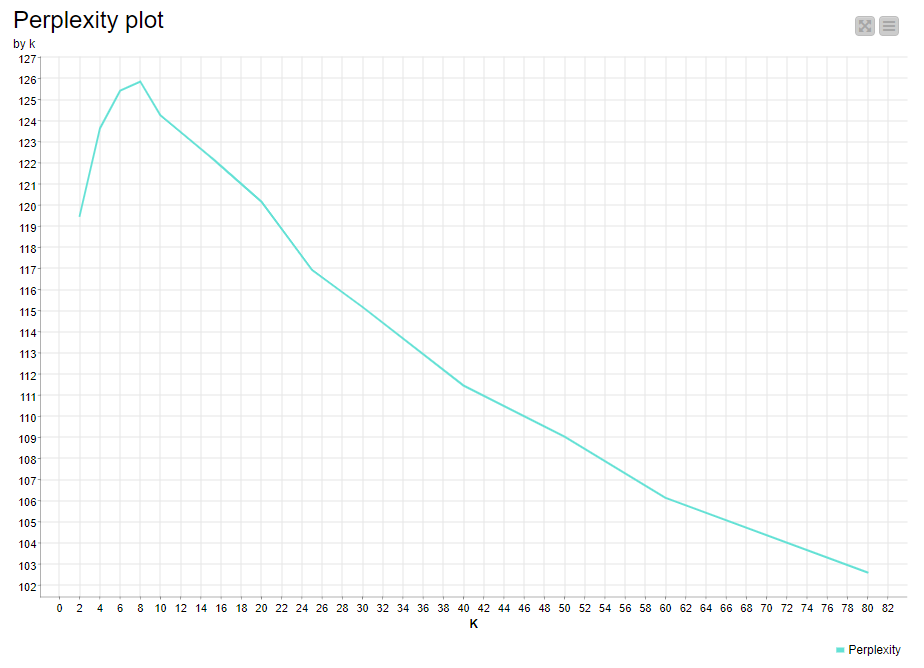
→ the “elbow” range is between 6 and 10
Step 2 - narrowing down the topic range (6 to 10)
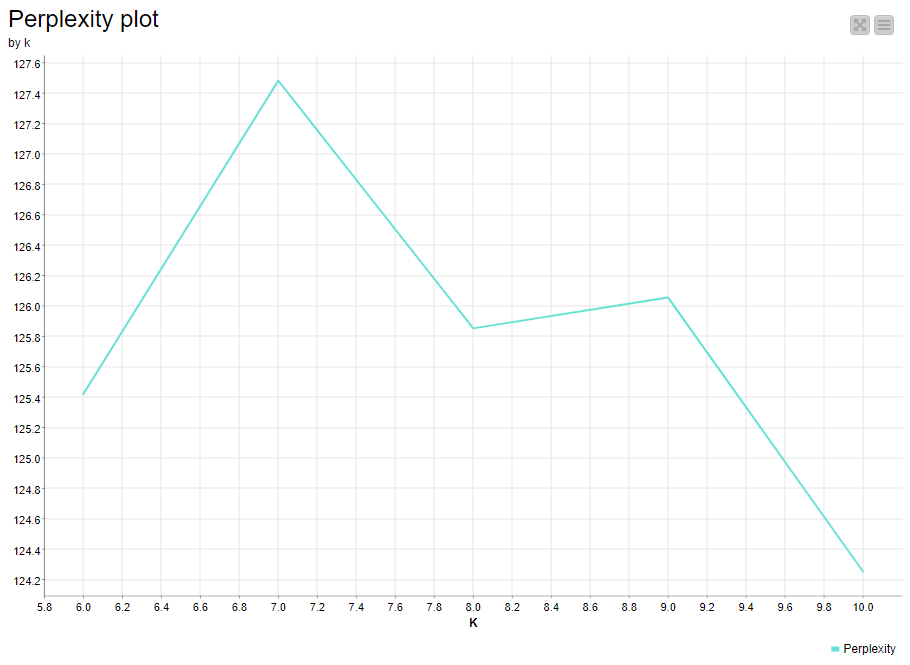
Now, acording to the last chart, what is the optimal number (7, 8 or 9)? Is my approach correct at all? Thanks!