How to create a stacked bar chart for Male/Female from a GroupBy node in KNIME?
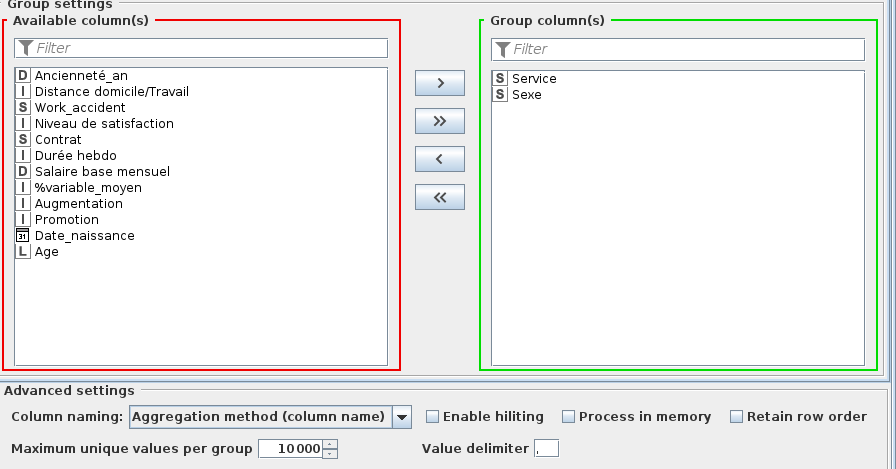
I am working with KNIME and trying to create a stacked bar chart that shows the distribution of males and females across different departments in my company.
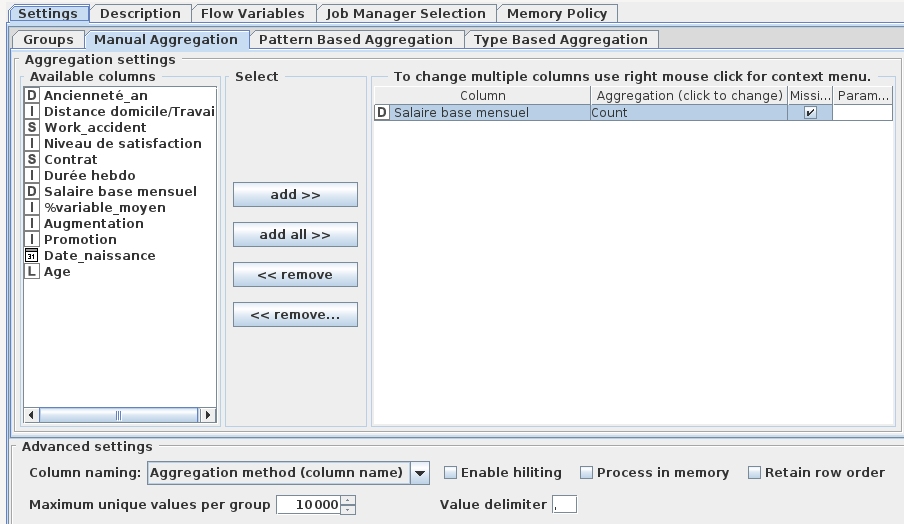
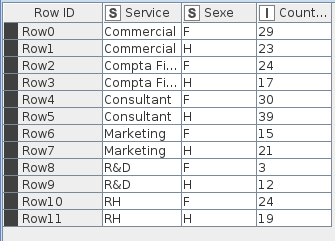
Here’s a snapshot of my DataFrame after applying a GroupBy node:
insert screenshot here
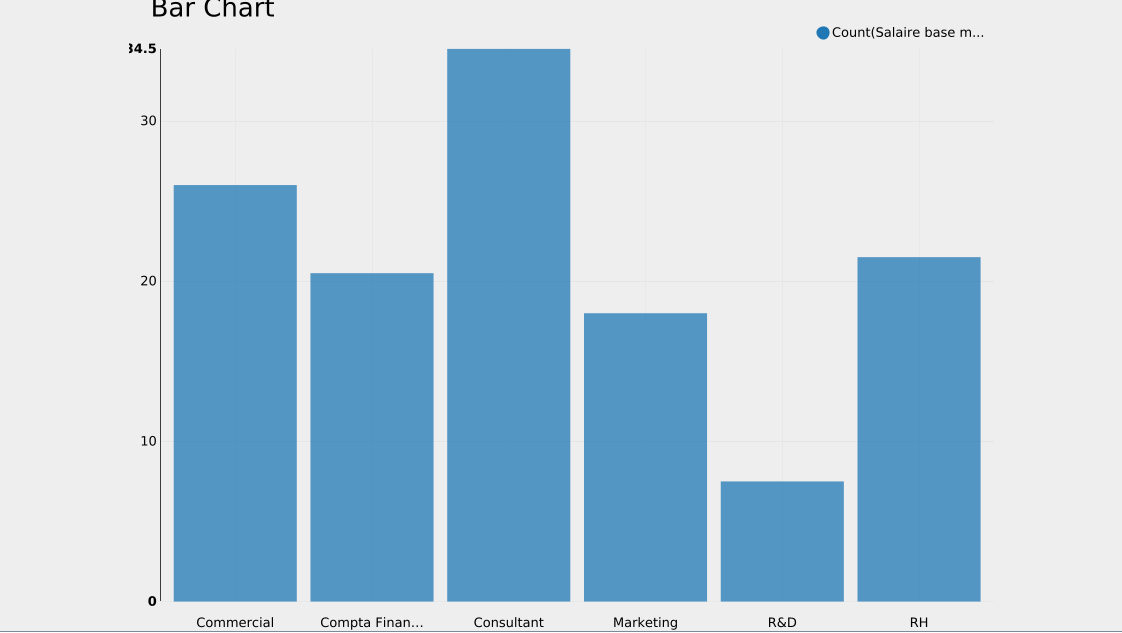
I would like to transform this data into a stacked bar chart where each bar represents a department, and the bar is split into two sections (one for males, one for females) based on the count of each gender in the department.
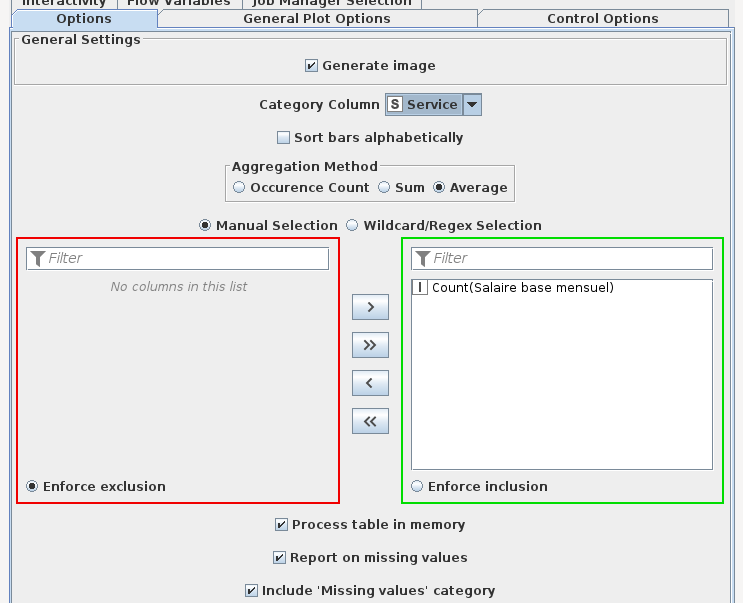
However, I am not sure how to achieve this in KNIME. I cannot find suitable options in the “Bar Chart” node. Could someone provide guidance on how to accomplish this?
KNIME 4.7.3