How do combine 2 string values (x axis) with sum (y axis)
I am currently working on the census report to determine age groups that earns <=50k or >50k.
I have used ‘Numeric binner’ to classify the age, and ‘colour manager’ to differentiate <=50k or >50k.
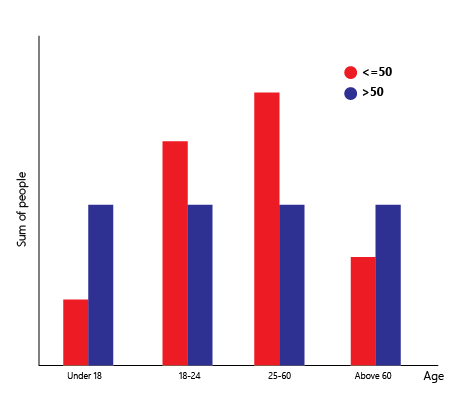
I will need a bar graph that looks like this (i drew the idea myself)
My current workflow
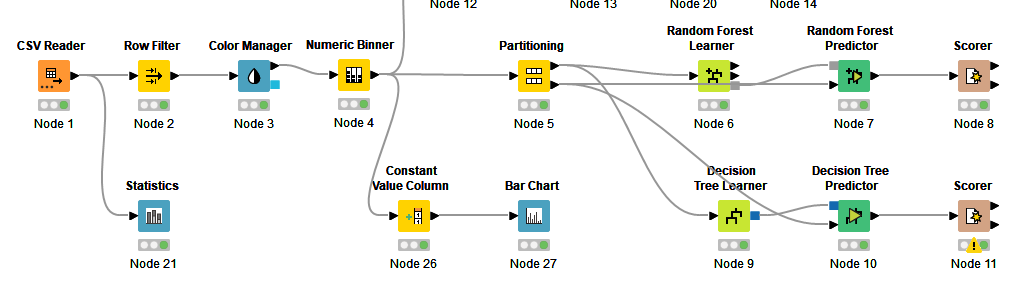
What should i do to get result as expected?