ECharts with dataset
Hello
I’m a bit stuck on using the ECharts view on my data.
I’m trying to recreate the following diagram we have in Excel:
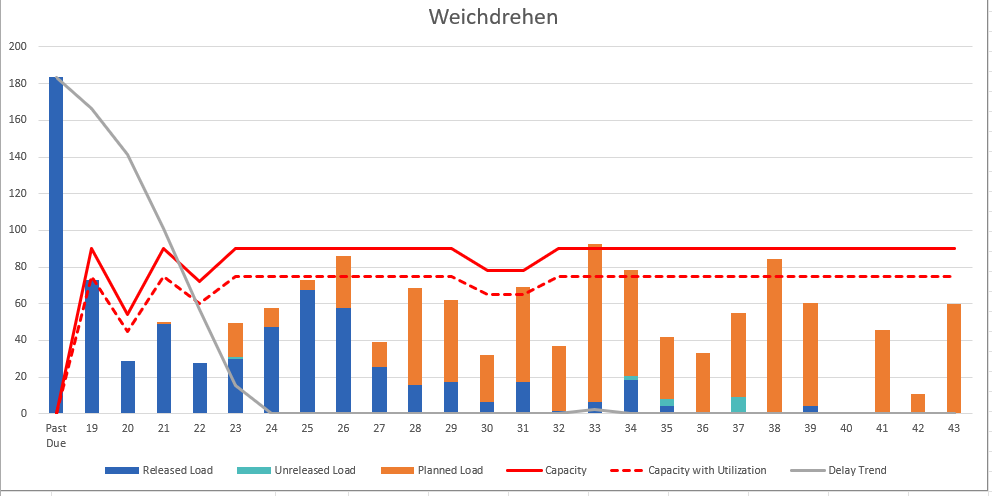
I’m working with the following table, columns go up to 44, I’ve already “pushed” the header down to row 1:
| Column 1   | Column 2 | Column 3 | Column 4 | E  | F  | G  | H  | I  | J  | K  | L   | M  | N  |
| Status     | Past Due | 19       | 20       | 21 | 22 | 23 | 24 | 25 | 26 | 27 | 28  | 29 | 30 |
| Planned    | ?        | 25       | 33       | 45 | 40 | 67 | 39 | 47 | 50 | 40 | 101 | 43 | 26 |
| Released   | 47       | 39       | 31       | 24 | 8  | 16 | 11 | 21 | 14 | 12 | ?   | 1  | 3  |
| Unreleased | 2        | 28       | 17       | 27 | 26 | 16 | 7  | 1  | 6  | 3  | 4   | 15 | 0  |
The status column refers to the “category” while the top row is past due or the calendar week.
I will always be the same 3 or 4 rows for the bars.
I could manually set up all the columns but I figured it should be easier to use the dataset option.
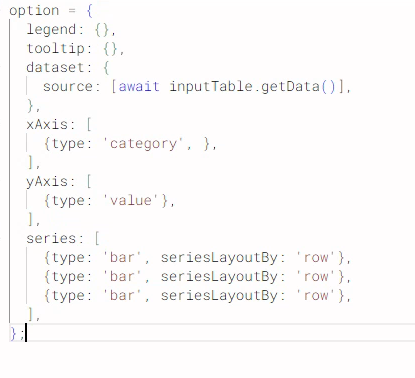
I’ve tried the following to no avail:
Thanks in advance