Date based S-curve
I’m looking to create an S-curve to show planned dates and actual dates. I’ve attached the excel doc and redacted sensitive info.
Drawing Production Tracker redacted.xlsx
What I’d like to show is how many documents are planned on a certain date, how many documents were actually issued on a certain date. So the output should be something like this:
| Date       | Planned Count | Actual Count | Planned Cumulative | Actual Cumulative |
| 01/01/2024 | 1             | 1            | 1                  | 1                 |
| 02/01/2024 | 3             | 2            | 4                  | 3                 |
| 03/01/2024 | 4             | 3            | 8                  | 6                 |
| 04/01/2024 | 2             | 4            | 10                 | 10                |
| 05/01/2024 | 4             | 2            | 14                 | 12                |
| 06/01/2024 | 2             | 3            | 16                 | 15                |
| 07/01/2024 | 3             | 2            | 19                 | 17                |
| 08/01/2024 | 4             | 2            | 23                 | 19                |
| 09/01/2024 | 2             | 1            | 25                 | 20                |
| 10/01/2024 | 2             | 2            | 27                 | 22                |
| 11/01/2024 | 4             | 2            | 31                 | 24                |
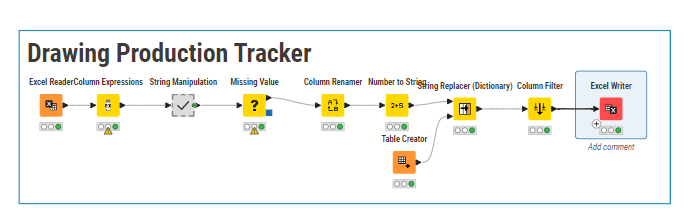
A section of my workflow looks like this but this was taking the original document and transforming it: