Creating a histogram with specific values
Hi Everyone,
I have a query regarding preparing a Histogram.
I have a table that is measuring time difference between previous rows and inputting it into a:- HH:MM:SS format.
The table is:
Now I want to plot these values and make a histogram with dynamic upper and lower control limits in the graph. The graph should look something like this:
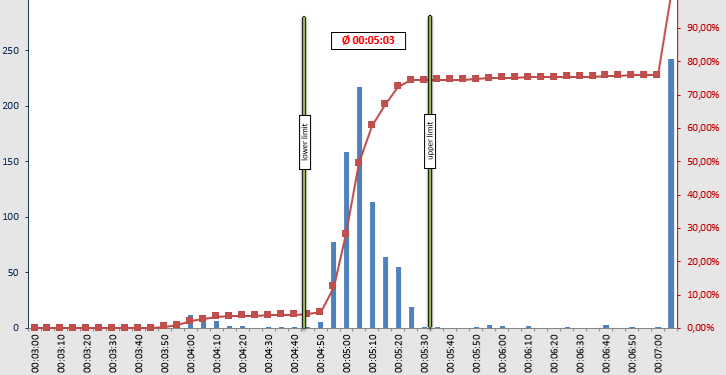
I could not find a method to make this graph using the normal Histogram nodes.
Is there a way that this kind of histogram can be plotted? Thanks.