Bubble plot - how they work?
Knime has two differents nodes to generate bubble plots: Bubble Chart (Ploty) and Bubble chart(JFreeChart). This two node give different view of the bubble dispersion inside the plots.
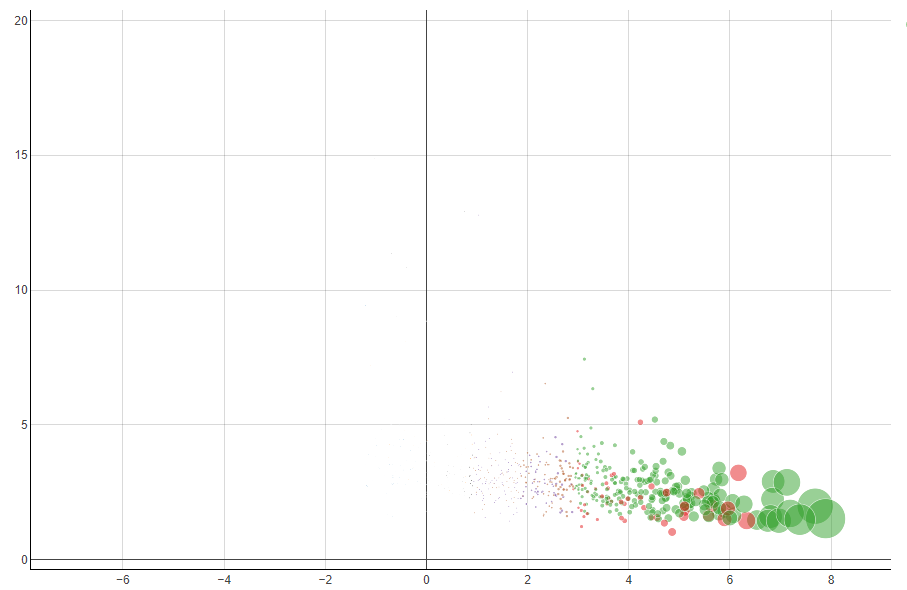
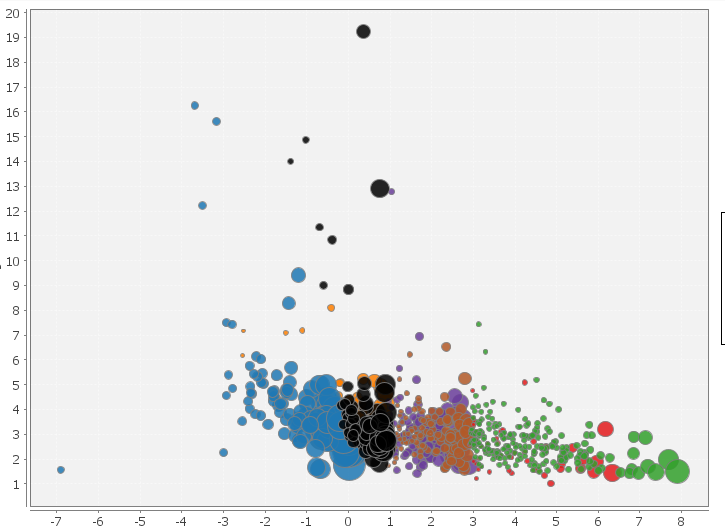
I don’t fully understand their behaviour, in order to understand my doubts I report two snapshots of the same data plotted with the two different nodes.
In the first plot all data below “0” are invisible (bubble radii too small) but the second plot show theese data with bubbles almost of the same dimension of the green bubbles!!! Why?
The configurations of the two nodes are the standard one proposed by knime
first plot: Bubble size parameter 40
Secondo plot: Normalize the radius (in the first plot there isn’t the option of radius normalization)