bar chart and group by
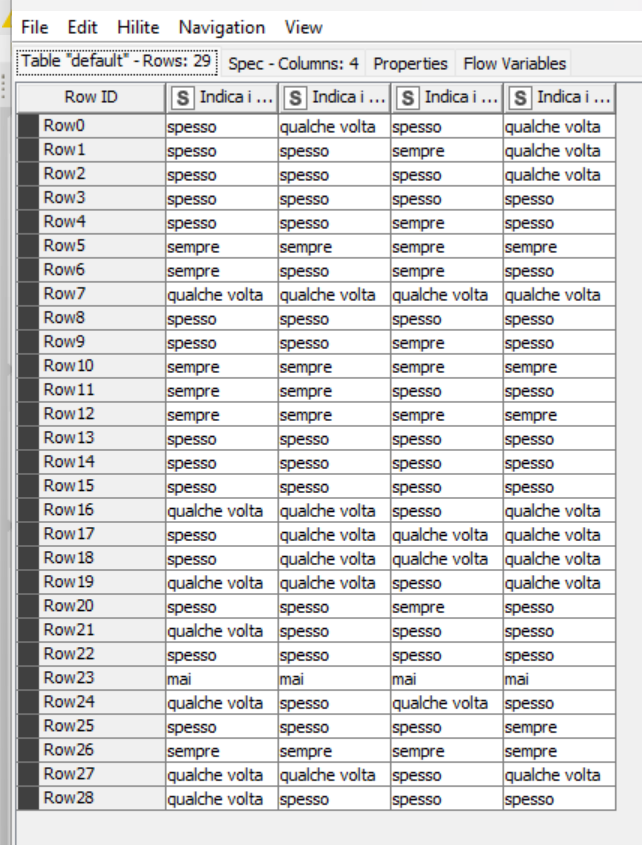
Hi, sorry for my english, I need to to do a bar chart with this data-set.
My idea is to plot four bar graphics in one single image, where the first plot represent the first categories and the frequency of the answers, and same graphics for the second, the third and the fourth categories.
Thanks for the help