3D Bar Chart
Dear Knimers,
I wish to plot my Covid data (on its initial 16 months) into a 3D Bar Chart. Is it possible to perform using just Knime resources? In such a case, which nodes should I use? Or there is any specific node (or component) to be used in similar situations?
My data are as follows:
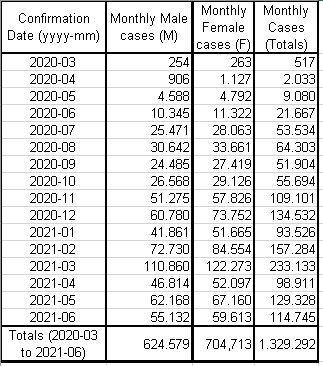
The same data are stored into this XLSX file:
In Excel, I easily got to perform the wished 3D Bar Chart, as follows:
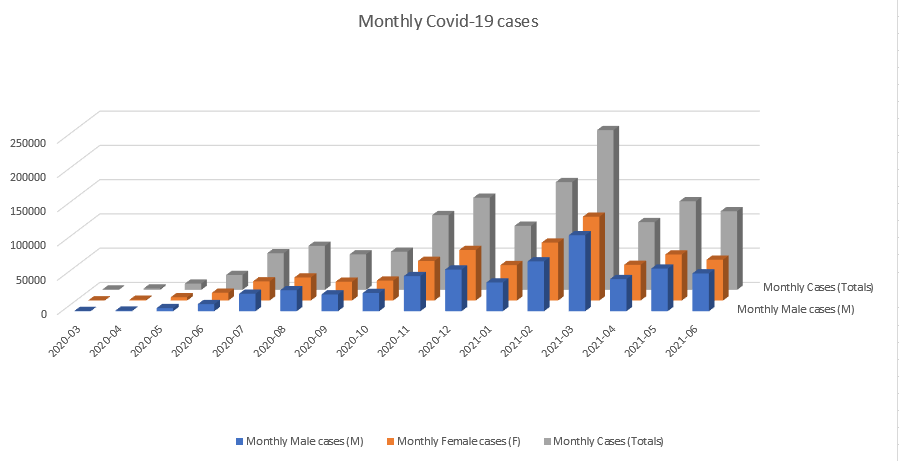
Can someone help me on this (probably very easy) task?
Thank you for any help.
Rogério.